Table of contents
Browse categories
Browse authors
 AL
ALAlessia Longo
 AH
AHAl Hoge
 BJ
BJBernard Jerman
 BČ
BČBojan Čontala
 CF
CFCarsten Frederiksen
 CS
CSCarsten Stjernfelt
 DC
DCDaniel Colmenares
 DF
DFDino Florjančič
 EB
EBEmanuele Burgognoni
 EK
EKEva Kalšek
Franck Beranger
 GR
GRGabriele Ribichini
Glacier Chen
 GS
GSGrant Maloy Smith
 HB
HBHelmut Behmüller
 IB
IBIza Burnik
 JO
JOJaka Ogorevc
 JR
JRJake Rosenthal
 JS
JSJernej Sirk
 JM
JMJohn Miller
 KM
KMKarla Yera Morales
 KD
KDKayla Day
 KS
KSKonrad Schweiger
Leslie Wang
 LS
LSLoïc Siret
 LJ
LJLuka Jerman
 MB
MBMarco Behmer
 MR
MRMarco Ribichini
 ML
MLMatic Lebar
 MS
MSMatjaž Strniša
 ME
MEMatthew Engquist
 ME
MEMichael Elmerick
Nicolas Phan
 OM
OMOwen Maginity
Patrick Fu
 PR
PRPrimož Rome
 RM
RMRok Mesar
 RS
RSRupert Schwarz
 SA
SASamuele Ardizio
 SK
SKSimon Kodrič
 SG
SGSøren Linnet Gjelstrup
 TH
THThorsten Hartleb
 TV
TVTirin Varghese
 UK
UKUrban Kuhar
Valentino Pagliara
 VS
VSVid Selič
 WK
WKWill Kooiker
Automated Sound Intensity Measurement on Loaders
The manual measurements with a sound intensity probe or a vane anemometer for a large number of measurement points are time-consuming and non-effective. The main reasons to do an automatization of such measurements are to achieve good repeatability, save time for other measurements, and improve analysis of the results.
On the other hand, the main challenge is, how to control the collaborative robot. The automated intensity probe measurements at Doosan Bobcat widely use the Dewesoft DAQ system - and DewesoftX software with the Sound Intensity plugin.
The Bobcat company
Bobcat is almost synonymous with small compact loaders, excavators, and tractors. The Bobcat Company leads the industry in the designing and manufacturing of compact equipment for construction, landscaping, agriculture, grounds maintenance, industry, and mining.
Having started in North Dakota, USA, in 1947, Bobcat today is a part of the Doosan Company. It is a global leader in construction equipment, power and water solutions, engines, and engineering.
The Bobcat manufacturing facilities are located in the USA, China, and the Czech Republic. The headquarters of Bobcat EMEA (Europe, Middle East, and Africa) is located within a modern campus in Dobris, Czech Republic including a manufacturing plant, innovation center, and training center (Bobcat institute) within the compound.


Sound intensity measurement
The intensity of a sound is also known as acoustic intensity. It is defined as the power carried by sound waves per unit area in a direction perpendicular to that area. The SI unit of intensity, which includes sound intensity, is the watt per square meter (W/m2).
Sound intensity is not the same physical quantity as sound pressure. Human hearing is directly sensitive to sound pressure which is related to sound intensity. In consumer audio electronics, the level differences are called "intensity" differences, but the sound intensity is a specifically defined quantity and cannot be sensed by a simple microphone.
Sound intensity level (SIL) or acoustic intensity level is the level (a logarithmic quantity) of the intensity of a sound relative to a reference value. It is denoted LI, expressed in nepers, bels, or decibels dB.
The measurement setup
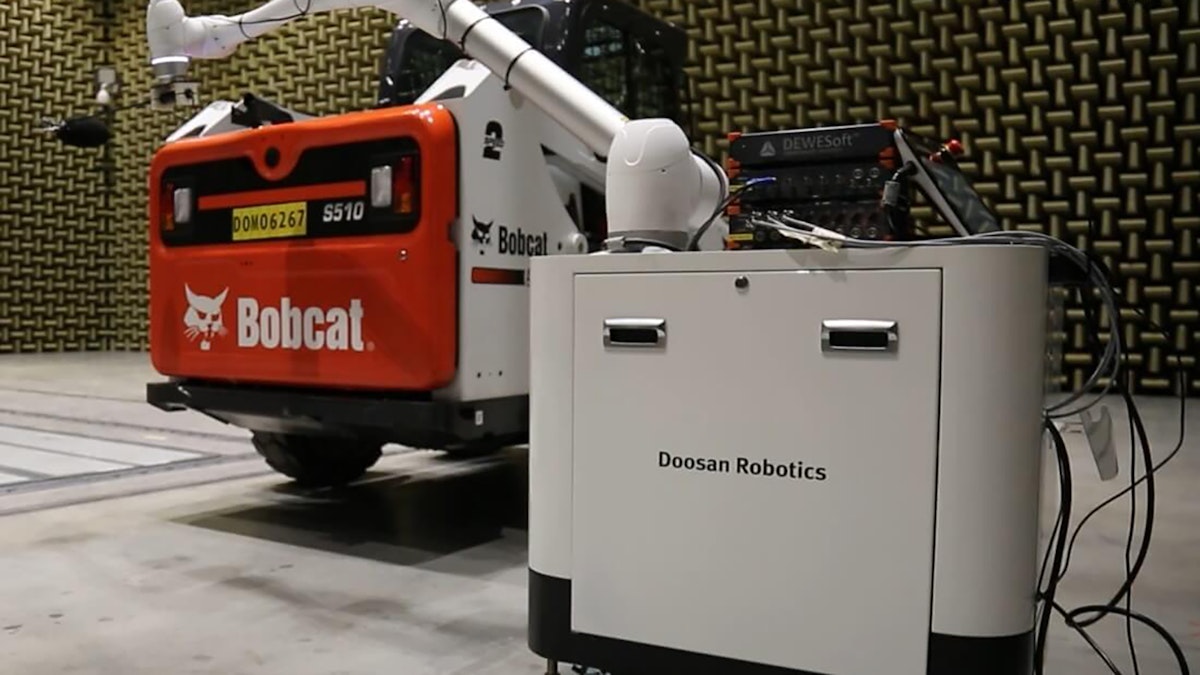
This application used wide variability of the Dewesoft DAQ systems. The acoustic signal from the Brüel & Kjær sound intensity probe Type 3599 was converted by a G.R.A.S. Intensity Power Module Type 12AB to the voltage output. It was synchronized with engine speed and many other quantities from the machine CAN bus signal. The acoustic measurement was performed in a semi-anechoic chamber.
The second application was the airflow measurement with a vane anemometer (Höntzch - TS26/16GE-mn40A/125/p0/ZG1). The output analog signal from the portable evaluation unit of the vane anemometer was stored with the ambient temperature.
The communication with the collaborative robot was carried out by the 3 analog inputs and 1 analog output.
Data acquisition system:
SIRIUS data acquisition system, model SIRIUSi-8xACC-8xAO - 8 analog channel IEPE/Voltage input, 8 channel IEPE/Voltage output
SIRIUS data acquisition system, model SIRIUSi-8xSTG+ - 8 analog channel, 8 counter channel
Sensors:
Brüel & Kjær Intensity probe Type 3599
G.R.A.S. Intensity Power Module Type 12AB
Höntzch vane anemometer- TS26/16GE-mn40A/125/p0/ZG1
Software:
Measurement description
The selected probe attached to the holder on the end of the robotic arm was positioned through the defined grid. The application with the sound intensity probe used a simple rectangular grid which is parallel to the measurement surface. The trajectory of the movement is defined by the initial point and increment in two axes, X and Y.
The measurement was performed for each node of the mesh according to the ISO 9614-1. This method is more time-consuming than scanning according to the ISO 9614-2 but offers more accurate and detailed information.


The positioning of the collaborative robot is initiated by the analog output from the Dewesoft data acquisition system. The measurement for each point is controlled by the trigger channel. This channel is an analog output from the collaborative robot.
The level and hysteresis of this channel were defined in the setup. The data storing started for point, when the trigger signal passed the defined level and stopped when the trigger signal dropped below this level. The time interval is defined by the length of the analog signal on a defined level. There are two options for the shape of the trajectory of the endpoint - the One direction or Both directions see the following Figure 2.


The airflow measurement with a vane anemometer was almost the same as for the sound intensity probe. The measurement of the airflow was near the heat exchanger or other surfaces which could be tilted. Therefore, the measurement grid was defined by 3 corner points.
This setup allows creation any generally inclined plane. The initialization of the measurement and setup of the trigger channel works the same as for intensity probe measurement. The space coordinates of the endpoints are recalculated to the 2D coordinate system of the plane. The X and Y coordinates of the endpoints are sent from the collaborative robot to Dewesoft as an analog signal.
The measurement result
The measured acoustics field shown in the DewesoftX measurement setup in Picture 2 has a 20x20 nodes grid. The time interval for each segment was 15 seconds - enough to obtain accurate data. The total time of the measurement was 1 hour and 40 minutes. The manual measurement for this number of points would be almost impossible.


The best option, how to analyze the acoustic results, was the identification of the most critical bands from the overall sound pressure level spectra and filtered the acoustic field for these bands.
When the picture was linked with the measured surface the acoustic results could identify each noise source separately (Engine, Axial Fan, Hydraulic pump, etc.). The focus of this method was to compare different design changes accurately and with good repeatability.


The airflow measurement results were exported to a Microsoft Excel template. This way of data processing offers efficient automatization of the reporting after the measurement. The workflow with the generated report template is shown in Picture 3.
The data was obtained from the measurement of the airflow near the heat exchanger of the machine. The values of the average air velocity for each segment were synchronized with the ambient temperature, engine speed from the can-bus, and axial fan speed from the optical sensor.
The characteristic value of the cooling system is the average mass flow through the heat exchanger. This value is based on the average velocity on the measured surface and air density corresponding to measured air temperature. This value is required for the validation of the CFD simulations of the machine cooling system. The velocity field was able to be used for the quick comparison of the different design configurations of the cooling package of the machine.
Learn more about sound & acoustic measurements with Dewesoft:


