What You’ll Learn 🎯
Differentiate signal types: understand digital pulses, encoders, tacho, gear-tooth, and tape sensors for angular measurement
Configure Dewesoft Counter inputs: event, gated, up/down counting, waveform timing (period, pulse-width, duty-cycle)
Use X1, X2, X4 encoder modes and zero-pulse mapping for precise shaft positioning
Measure period, pulse-width, duty-cycle, frequency, and RPM with nanosecond timing resolution via SuperCounter®
Apply input filtering to eliminate sensor glitches; learn calculation for optimum filter duration
Compute angular position and speed in real-time; use Counter math to reprocess angle/frequency calculations offline
Ensure high accuracy with 102.4 MHz SuperCounter timebase and automatic signal adjustment for gear-tooth and tape sensors
Export digital channels and integrate with modules like Order Tracking, Torsional Vibration, or custom math tools
Course overview
This course equips engineers and technicians to accurately measure angular position, frequency, and timing metrics using Dewesoft’s counter inputs and SuperCounter® technology. Beginning with foundational digital concepts, it explores how pulses from encoders, tacho, gear-tooth, and tape sensors translate into digital signals that can be synchronized with analog data.
You’ll then configure digital counter and encoder modes—covering event counting, period, pulse-width, duty-cycle, X‑mode encoders, and zero-pulse alignment. Input filters, calculated based on maximum RPM and pulses per revolution, are key to suppress voltage spikes and ensure signal integrity.
A highlight is the SuperCounter® feature, which timestamps digital events at 102.4 MHz. This enables angle and RPM calculations with nanosecond precision, even synchronized with analog and CAN data. You’ll use Dewesoft’s Counter math module to process or correct angle/frequency channels offline when needed.
Finally, the course shows how to export digital measurement data and integrate it with modules like Order Tracking or Torsional Vibration. Whether you’re balancing rotors, analyzing drivetrain twist, or tracking speed harmonics, this course ensures your digital measurements are precise and fully synchronized for advanced analysis.
What is a digital signal?
Most engineers understand that data acquisition systems are used to measure time-history signals, such as voltages, temperatures, currents, vibrations sensed by accelerometers, and strain measured by Wheatstone bridge strain gauge sensors.
However, it is often also necessary to measure discrete events and angle-of-rotation signals that are synchronous with more common time-history data. Discrete events are those with only two possible states, such as on/off switches.
These are sometimes called digital signals, since they are fundamentally composed of high/low (on/off) voltage states. In the sections that follow, we will present examples of these additional signal types and discuss how they are best measured and synchronized with the rest of the data.
What are discrete signals / digital signals?
Consider the case of a proximity switch or sensor, which outputs a low voltage (0 V in this example) when the unit under test (UUT) is not nearby, and a higher voltage (5 V) when the UUT comes within range. It may be necessary to record this discrete state in sync with the measuring system in order to put the analog data into context. So how can we do this?
One simple way to acquire these electrical signals is to feed them into the analog inputs of the measuring system. This approach works and only uses one analog channel. However, what if we need to record the states of eight proximity sensors—or ten or more?
In that case, it would be a significant waste of our wide-ranging and relatively expensive analog inputs to use them for such simple discrete signals. Furthermore, discrete inputs sometimes require higher bandwidth than the relatively slow analog inputs can support, making analog inputs a poor choice in such scenarios.
When multiple discrete signals must be acquired, it is more efficient and far less expensive to use a digital input designed for this task. In Dewesoft DAQ systems, such as the SIRIUS product line, each counter input can handle a variety of sensors with discrete digital outputs (such as counters and encoders), as well as several standard discrete digital inputs.
Since counters and encoders typically operate at very high rates, the time base of these inputs is also very high—102.4 MHz, providing a 10 MHz bandwidth, which far exceeds the capability of typical analog inputs for physical measurement.
The simplest form of digital input is the on/off type of signal, which appears as a square wave. These are often referred to as discrete channels or event channels. Because they have only two states, they are widely used to indicate conditions such as whether a door is open or closed, whether a circuit is on or off, or whether a blade has passed a sensor—among countless other yes/no applications.
What is a TTL signal?
Discrete inputs are often output from a relay or transducer at TTL (Transistor-to-Transistor Logic) levels, which are based on a 5 V pull-up. In theory, the ideal TTL on/off signal would be 0 V representing OFF (digital value 0) and 5 V representing ON (digital value 1).
However, in practice it is nearly impossible to achieve this precision. Therefore, the accepted voltage ranges are 0–0.8 V for OFF and 2–5 V for ON.
Dewesoft digital / discrete Inputs
Dewesoft’s Counter/Encoder inputs provide three channels that can be used for discrete/digital signals. Certain models also include dedicated DI (Digital Input) lines, separate from the counter inputs.
What is counter or encoder and application where its used
What is counter or encoder?
Counters and encoders are designed to count pulses. But why? In some cases, the application truly is just counting. More often, however, they are used to measure angle or angular position.
For example, consider the steering wheel in your car. It is important to know exactly which way the car is being steered in real time. An encoder within the steering wheel divides the 360° of rotation into thousands of discrete steps. It is also configured so that the top-dead position (steering straight ahead) corresponds to a known rotational value.
All modern safety and collision-avoidance features—as well as self-driving technologies in passenger cars, farming vehicles, and more—rely on this encoder to determine the exact position of the steering wheel at all times.
A similar principle applies to the rotary dial on the dashboard, where you adjust the radio’s volume or change channels. This dial is actually an encoder with a digital output that feeds into a microcontroller. The controller reads the encoder’s position and allows you to step through possible options, rotating continuously in either direction.
Typically, the volume encoder has defined start and stop positions, while the channel-selection encoder can rotate endlessly through the available stations. These are just three examples of encoder applications that most people encounter daily in their automobiles.
Counter and encoder applications
Position and angular position sensors can be found in a wide range of applications, including:
Steering wheel position sensing
Pedal position sensing
Throttle position sensing
Torque sensing
Process machine monitoring and control (thousands of uses)
Maintaining absolute position references in CNC machines
Controlling patient position in CAT (Computerized Axial Tomography) and MRI machines
Position feedback in robotics of all types
Electronic systems, particularly human–machine interfaces
Conveyor belt applications
Parking sensors
An angular position sensor measures the angular position of a shaft. These sensors are available in a variety of packages and resolutions—from simple inductive sensors that count each shaft rotation to high-resolution encoders that provide hundreds or thousands of steps around the 360° rotation and can also indicate direction of rotation.
There are several types of counter and encoder sensors used in data acquisition today, including:
| Sensor type | Description |
|---|---|
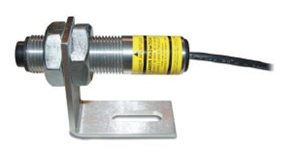
| Proximity Sensors | Detects an object coming within a prescribed distance of the sensor and outputs a pulse. Used for counting, tachometer, and rotations speeds applications |
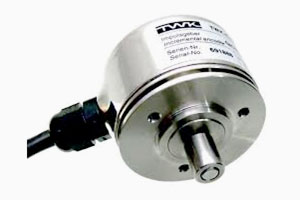
| Rotary Encoders | Rotary shaft sensor that outputs A, B, and Z signals with up to thousands of pulses of resolution around 360° |
| Linear Encoders | Same technology as a rotary encoder except that these encoders work in a linear fashion, i.e., in a straight line |
| Gear Tooth Sensors | Sensors with the defined number of pulses per revolution (usually 60), sometimes with missing teeth (60-2) for angle or starting point is known, |
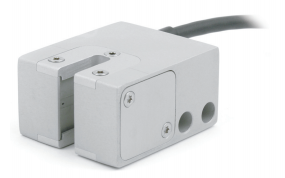
| Optical sensors | Non-contact optical angle sensor that detects either hole in a rotating disc or white/black stripes on tape affixed to a shaft. |
What is a digital counter?
An electronic counter is a digital input circuit that counts the number of pulses received from proximity sensors, encoders, and similar devices. The simplest type of digital counter tracks and counts time and pulses. Much like a stopwatch, it can be reset and configured to count up to a certain value.
The simple counters provided by most manufacturers usually offer sufficient capability when used alone. However, when they are part of a data acquisition system that is simultaneously measuring analog data—and perhaps additional inputs such as CAN bus data, PMC data, or video frames—they rarely provide true real-time synchronization across all inputs. This is where SuperCounter® technology from Dewesoft comes in.
Dewesoft SuperCounter®
Counters are primarily used for measuring RPM and the angle of rotating machines. Dewesoft SuperCounters® operate on a 102.4 MHz internal time base, independent of the current sample rate. In comparison to standard counters, which only output whole numbers (e.g., 1, 1, 2, 2, 3, 4…) one sample later, Dewesoft can extract precise values such as 1.37, 1.87, 2.37… that are fully time- and amplitude-synchronized. This is achieved by measuring the exact time of the rising edge of the signal with an additional counter. Each counter includes three digital inputs that are fully synchronized with analog data.
Dewesoft SuperCounter® technology is compatible with a broad range of encoders, gear-tooth sensors, proximity sensors, and more. Dewesoft systems such as SIRIUS, DEWE-43A, MINITAURs, and KRYPTON can be configured with one or more SuperCounter inputs. These inputs are typically provided on rugged locking LEMO connectors, although other connector types are available on some models.
There are typically three inputs because encoders require them. If you want to measure discrete inputs (TTL on/off signals), you can use these three inputs as independent discrete channels instead of for a counter. In addition, +12 V and +5 V sensor supply voltages are available, along with a digital output (to be discussed in a different article) and a ground connection.
The inputs are TTL level, meaning their low state must be below 0.8 V, and their high state must be above 2 V (up to 5 V). Let’s take a closer look at the electronic specifications for SIRIUS counters:
| SuperCounter® Inputs | |
|---|---|
| Timebase | 102.4 MHz |
| Timebase accuracy Typical | 5 ppm, Max: 20 ppm |
| Max. Bandwidth | 10 MHz |
| Input filter | 500 ns, 1 μs, 2 μs, 4 μs, 5 μs, and 7.5 μs |
| Input level compatibility | TTL (Low: <0.8, High: >2V) |
| Input impedance | 100kΩ pull-up to +3.3V |
| Input protection | ±25Volt continuous |
| Alarm output | Open collector, max. 100mA/30V |
| Sensor supply | 5V/100mA, 12V/50mA |
Before we dive into the digital input operating modes and how to use them, it’s important to review a key aspect that makes SuperCounters unique — their ability to precisely align counter data with analog and other data.
Aligning counter data with analog data
Standard counters available on most DAQ systems provide only integer resolution outputs (e.g., 1, 1, 2, 2). As a result, their outputs are always one sample behind the analog sensor data. This delay can cause significant problems in applications such as rotational or torsional vibration, where even a single-sample phase shift can alter results.
SuperCounters completely solve this issue by extracting floating-point values (e.g., 1.37, 1.87, 2.37) and aligning them precisely in time with the rest of your data. In fact, a SuperCounter is essentially two counters in one: the input is fed in parallel into both, while the sub-counter measures the exact time of the rising edge of the signal. This allows the system to calculate the true counter value relative to the analog signals, ensuring perfect alignment.
The video below demonstrates how SuperCounter technology measures counter signals fully synchronized with the analog channels. It also includes a real-world comparison between normal counting mode and SuperCounter mode.
Other data sources, such as CAN bus, XCP, and video, are also synchronized with the analog data in all Dewesoft data acquisition systems.
The key advantage of this technique is that Dewesoft's SuperCounters operate on a 102.4 MHz time base, which is independent of and significantly higher than the analog sampling rate.
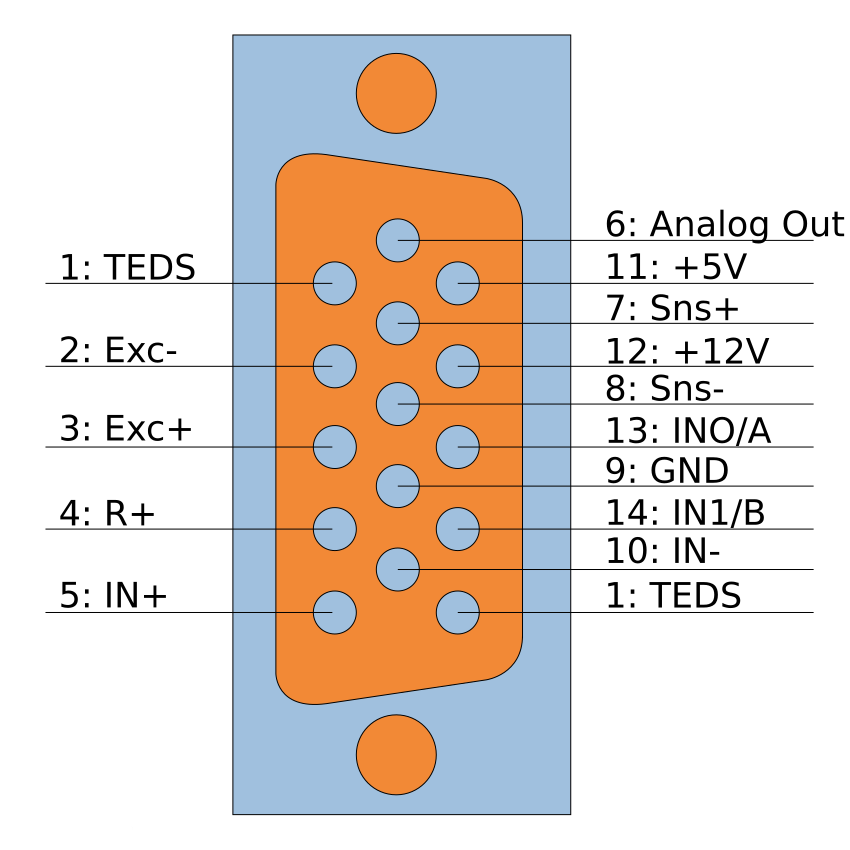
There is also a special counter pinout on the SIRIUS slice, called STGM-DB.
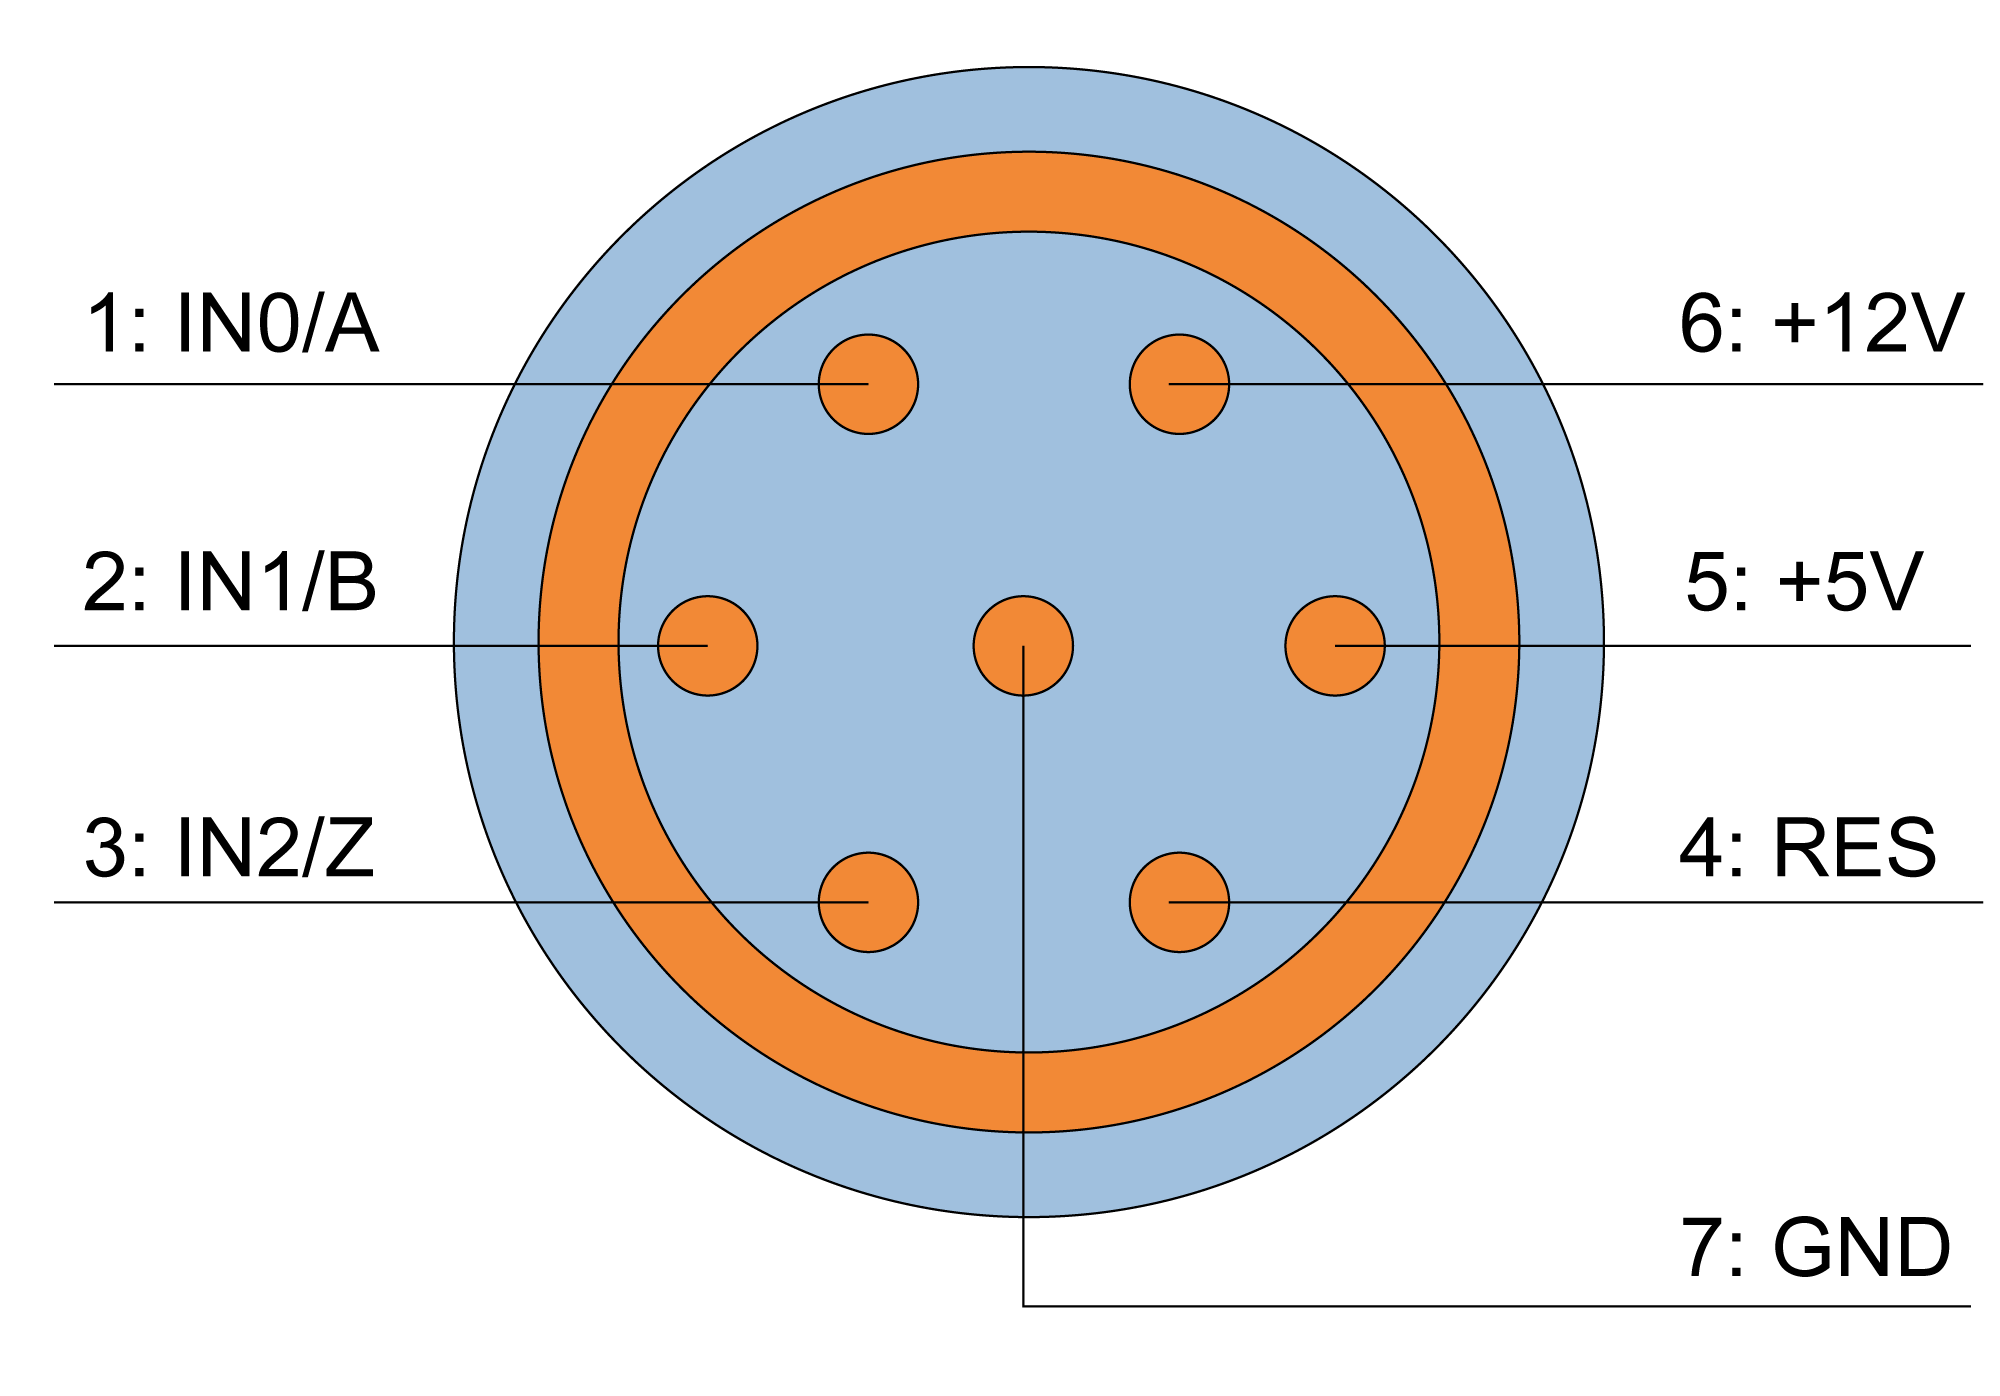
Digital inputs can be connected to several Dewesoft DAQ devices. Refer to the image below for more details.
Counters in Dewesoft
An electronic counter is a sequential digital device used to count the number of pulses received on the input line within a specific time period.
There are many different types of counters, each designed to meet particular application requirements. The simplest type of digital counter tracks and counts time, working similarly to a stopwatch. Such counters can be reset and can count up to a specified value.
The Dewesoft Counter module is used to perform counting and frequency measurements. Typical applications include:
Event counting (basic, gated, up/down, basic encoder)
Sensor applications (encoder, tacho, CDM, 60-2, etc.)
Waveform timing (period, pulse width, duty cycle)
A special mode, called SuperCounter, allows precise frequency measurement and provides direct support for the most commonly used sensors. Other counters typically offer only a limited subset of functions.
Basically, the input to the counter should be a clean digital signal, with most cards supporting 5 V levels by default (some cards support higher input signals or even variable trigger levels). If the signal is either lower or higher, additional conditioning should be applied before the counters.
Input filter and the importance of filtering
The importance of filtering
In the real world, noise and glitches on counter outputs are not uncommon. The issue is that if glitches are high enough in amplitude, they can be counted as pulses, resulting in incorrect values. Dewesoft SuperCounters provide advanced input filtering to mitigate this problem, similar to filtering techniques used in the analog domain.
Setting the filter
We need to configure the input filter for the counters. This filter prevents glitches and spikes in the digital encoder pulse signal. It can be set from 100 ns to 5 µs, with the optimal setting determined by the following equation:
Where:
RPMmaxRPM_{max}RPMmax represents the maximum revolutions per minute [RPM].
PulsesPerRevolutionPulsesPerRevolutionPulsesPerRevolution is the number of pulses per revolution of the sensor.
Suppose our machine is running at 3000 RPM and we have an encoder with 512 pulses per revolution. If we insert these values into the equation above, we obtain the following result:
We need to set the filter to react slightly faster than the expected events, but also slower than the anticipated frequency of glitches. With a manual switch and a 102.4 MHz base clock, some glitches are to be expected.
The red curve represents the digital signal from the switch, while the blue curve shows the counter value. The counter value increases with each transition from low to high.
At some points, we can see that the values are counted up even when there is a glitch (not a real pulse). This happens because the counter can detect every glitch in the signal, even those shorter than 20 nanoseconds. Therefore, we need to apply a filter to eliminate these glitches.
For example, if we use a filter set to 500 nanoseconds, it will check whether each pulse remains high for at least 500 nanoseconds. If this condition is met, the counter value is increased.
Basic event counting
Basic event counting is a mode in which either the falling or rising edges of a signal can be counted. To use it, you only need to connect the signal to one of the counter inputs and ground.
In this example, we simply add a switch between the counter input and ground. Since all inputs have pull-ups, closing the switch will register as zero, while opening it will register as one.
In the software, select the Event Counting application, then choose the Basic Event Counting mode. Next, specify which input pin the signal is connected to. You can configure the system to count UP or DOWN, and there is also a checkbox that allows you to reset the count at the start of the measurement if desired.
By default, the normal state (when the switch is not pressed) is high. Therefore, it is useful to invert the signal by selecting the "inv" checkbox.
This has two effects:
The logic levels are inverted, so when the button is not pressed, the level will be low.
As a result, the counter will count on falling edges.
Measurement using Basic Event Counting
Gated event counting
In gated counting mode, a pulse is counted only when the gate signal is high. Connect the pulse signal to input IN0 (and ground), and connect a second signal to input IN1, which serves as the gate signal.
The counter signal is connected to the same input as in Simple Event Counting, but an additional second signal—the gate—must also be connected. The second switch should be connected to CNT_IN1.
Next, configure the counter channel by selecting Gated Event Counting mode and setting the Signal input (CNT_IN0) and the Signal gate (CNT_IN1).
The counter will count transitions from low to high only when the signal gate is high. Since the signal gate is inverted (normally high), it is necessary to invert the gate signal so that counting occurs only when a button is pressed.
In the example below, we can see how this counter works.
The green signal (from the counter) counts upward when the red signal (the gate signal) transitions from low to high, and only while the gate signal (red) remains high.
Up/down counting
Up/down counting is a counter operation that increments when the gate signal is high and decrements when the gate signal is low. The encoder operation works similarly, and in fact, this mode can be used to make X1 encoder measurements, although some additional electronics are required.
If you look at Image 20, you can see that the counter value at the last counter source pulse equals -2. How?
At the first counter source pulse, the value became -1, since the counter auxiliary gate was low at that time. It continued counting negatively until the 4th counter source pulse. When the counter auxiliary gate switched to high, the counter started counting in the positive direction. By the end of the gate’s high state, the counter value was -1. Afterward, when the gate returned low, the counter resumed counting negatively, resulting in a final value of -2 at the last counter source pulse.
The connection is the same as in the previous example — gated event counting. In the Channel setup, select Up/Down counting as the counting mode, then assign the Signal input (CNT_IN0) and the Up/Down signal (CNT_IN1).
In the measurement, we can see that when the gate signal (red) is low, the counter counts in the negative direction (blue). When the gate signal is high, the counter counts in the positive direction.
Basic encoder counting and X1, X2 and X4 modes
The simple encoder mode can be selected by choosing Event Counting and then Basic Encoder Counting.
First, let’s set up the encoder. Signal A is assigned to CNT_IN0 and Signal B to CNT_IN1. We set the encoder mode to X1 and adjust the input filter to match the highest expected frequency. Scaling is straightforward — simply select counts, revolutions, or degrees from the drop-down menu, or enter a custom scale factor.
Now let’s take some measurements. This counter counts up when Signal A leads Signal B, and counts down when Signal B leads Signal A. The positive edges of Signal A are used to calculate the counts.
If we choose X2 mode in the setup, the counter will count both the rising and falling edges of Source A, thereby increasing the resolution by a factor of two. Everything else remains the same.
X4 mode counts the rising and falling edges of both Signal A and Signal B. As a result, the measurement resolution is increased by a factor of four.
Sensor accuracy
An additional error can occur due to the mechanical tolerances of the encoder used. Depending on the encoder mode setting (X1, X2, or X4), these tolerances can influence the measurement.
X1 mode
In X1 mode, only the rising edge is relevant. If the sensor marks do not repeat precisely at constant angular intervals (i.e., if there is jitter), this error can be compensated for using the reference curve option.
Good:
Bad:
X2 mode
In X2 mode, both the rising and falling edges of the first encoder track are used, which doubles the resolution. However, if the duty cycle is not exactly 50%, an additional error is introduced.
Good:
Bad:
X4 mode
In X4 mode, both the rising and falling edges of both encoder tracks are used, providing four times the resolution. For accurate measurement, the phase shift between the two tracks must be exactly 90°, and the duty cycle must be 50%.
Good:
Bad:
Of course, when using two encoders (as in torsional vibration measurements), the errors are effectively doubled.
Encoder with zero pulse
The zero pulse is used to reset the measurement whenever a Z pulse is detected.
The only change required in the setup is to select the Encoder zero checkbox. This will reset the counter value to 0 each time a zero pulse occurs.
These signals can also be inverted in Dewesoft.
You also need to set the number of encoder pulses for internal calculations (360 in this case).
The image below illustrates the operation. The blue curve represents the zero signal, while the magenta and orange curves represent the encoder outputs. When a pulse is detected on the zero pulse input, the counter value resets to 0. The red curve shows the counter value.
The image below shows a zoomed-in region of the recorder. It illustrates how the encoder resets its value at the zero pulses and then continues counting upward on the rising edges of the A signal.
Example of a defective encoder
The encoder’s fatigue life is shortened by non-centric mounting, which causes vibrations.
Normally, the Z reset pulse appears when both the A and B signals are high. In the case shown below, however, the Z pulse remains high for more than one period, indicating a fault, and the encoder must be replaced. Typically, this issue can be identified by spikes in the frequency signal. To detect it, sample the raw A, B, and Z signals at the highest sampling rate (e.g., 200 kHz) while slowly turning the machine.
Waveform timing
When choosing Waveform Timing, the available timing modes are Period, Pulse Width, and Duty Cycle.
Period and pulse-width measurements are similar in function. A period measurement determines the time between two consecutive low-to-high transitions, while a pulse-width measurement determines the duration of time the signal remains high. The duty cycle represents the ratio of the high (or low) portion of the signal to the entire period.
| REQUIRED HARDWARE | DEWE-43, SIRIUS ACC+, MULTI |
| REQUIRED SOFTWARE | DEWESOFT X |
| SETUP SAMPLE RATE | AT LEAST 1 kHz |
We will use the same configuration with two buttons for this measurement. The hardware connection is simple — only one switch is connected to CNT_IN0.
IMPORTANT: Due to FPGA limitations, the DEWE-43 does not support the “Repeat last value” option. This functionality is exclusive to SIRIUS units.
Period measurements
First, select the Basic application as Waveform Timing and set the Timing mode to Period, Pulse Width, Duty Cycle.
Set the Signal input to CNT_IN0 and invert the signal by checking the Inv checkbox so that it is normally low. You can also set the Input filter to prevent glitches.
A new value is calculated only when the signal changes from low to high. Therefore, most of the time, the value cannot be calculated. In such cases, you can choose to output a zero value when no new data is available. This way, spikes will appear only at the points of new data, while the rest of the signal remains at zero.
The example below shows how the measurement is performed. The two white cursors in the recorder indicate the time difference between two pulses (displayed on the left side of the recorder setup screen). The measured value reads 201.8 microseconds, while the counter value is more precise, showing 202.7 microseconds.
Since the counters run with an 80 MHz clock, we achieve microsecond-level resolution. From the period, the counter also calculates the frequency, which is simply the reciprocal of the period (1/period). The units for both period values and frequency can be set in the channel list on the setup screen.
Pulse-width measurements
The pulse-width measurement setup is the same as the one previously described in the period measurement example. In the Timing mode section, we select the Period, pulse width, duty cycle option.
The readout is updated on each high-to-low transition. In this case, the recorder cursor shows 98.8 microseconds, while the counter value shows 0.1029 milliseconds.
We can use the SuperCounter to measure both the low and high times of each pulse or to combine the period and pulse width in order to calculate the duty cycle of the signal.
Duty cycle
The duty cycle measurement is the process of determining the ratio between the high (or low) pulse of a signal and its period.
As stated in the encoder tutorial, the choice of X1, X2, or X4 mode depends on the quality of both the encoder and its associated electronics. In this example, we will use the same encoder from the tutorial to evaluate its quality. For this measurement, the Timing mode must be set to Period, pulse width, and duty cycle. If this option is not available, the counter does not support it.
We can then directly select the Period, Pulse width, Duty cycle, and Frequency output channels. The counters are automatically configured for this operation.
Now let's examine the duty cycle measurements. The upper graph in the figure below shows the period and pulse width of the signals, while the lower graph displays the duty cycle over several rotations of the encoder. We can clearly observe a few points where the encoder exhibits slightly larger errors compared to the rest of the data. At those points, the value is approximately 51.978%, indicating that the encoder in X2 mode will have around a 2% error.
Sensor measurement
| REQUIRED HARDWARE | DEWE-43, SIRIUS ACC+, MULTI |
| REQUIRED SOFTWARE | DEWESOFT X |
| SETUP SAMPLE RATE | AT LEAST 1kHz |
The SuperCounter mode is also used in a special counter mode called "Sensor" mode (selected from the Basic application drop-down menu). This mode allows the direct use of digital speed and position sensors as defined in the Counter Sensor Editor. Supported sensors include rotary encoders, linear encoders, CDM sensors (angle sensors with zero reference), gear-tooth sensors with missing or double teeth, and tacho probes.
To use this mode, simply select the appropriate sensor from the Sensor Type drop-down menu. If the sensor is not yet defined, click the ellipsis button (…) on the right side to open the Counter Sensor Editor, where new sensors can be defined. All sensors configured here will always operate in SuperCounter mode, providing exact frequency and angle measurements.
The advantage of using sensors is that scaling is performed automatically, eliminating the need for manual adjustments. Additional options are available, such as selecting the Encoder mode (X1, X2, or X4) and enabling or disabling the Encoder zero option.
For CDM, tacho, and gear-tooth sensors, no special settings are required. Their behavior depends solely on how the sensors are defined in the Sensor Editor.
DS TACHO 4 - tape sensor
The DS-TACHO4 sensor is a threshold sensor. This is especially important in proximity detection mode, the most commonly used mode for rotating applications. The working distance may vary depending on the albedo, the shape and distance of the target, and the contrast (e.g., teeth/no teeth or black-and-white marks).
For encoding applications, the recommended distance is just a few millimeters. Position the probe close to the target to avoid incorrect readings caused by rocking or wobbling of the rotating part (according to Descartes’ optical law). In contrast, using reflective tape allows for detection at distances greater than 100 mm. For optimal results, it is highly recommended to use adhesive encoders.
Several factors may affect detection performance, including drops of liquid on the probe surface, excessive dust buildup, or, more generally, a non-transparent environment for the light source (e.g., diesel engine sump film — carbon is not transparent to near-infrared). The patented concept implemented in the sensor simplifies mounting and setup significantly.
Before measurement, it is recommended to perform a detection test, even at low speeds, to verify detection feasibility and determine the required detection distance.
If a test is not possible due to technical constraints or mounting specifics, a theoretical method is to position the probe at a distance equivalent to the width of the black and white strips to be detected — in any case, without exceeding 4 mm.
Applications
Recommended for acyclism and torsional vibration measurements
Suitable for test bench and embedded measurements
Applicable to rotating machines, including combustion engines, electric and hybrid motors, hydrogen systems, and turbines
Mounting the probe
Ensure that you have all the required items at hand: the sensor, the probe, and the two hand-pieces for optical fixation.
Place the two hand-pieces aside if they are currently mounted on the optical head of the sensor.
Insert the two optical fibers along with their respective rivets.
Screw on the first hand-piece and tighten it moderately. A small gap between the rivet head and the optical head is normal.
Remove the two fibers to allow for the mounting of the second hand-piece.
Confirm that the two fibers and their rivets are assembled correctly.
When inserting the rubber sleeve, hold both the probe and the sensor simultaneously to avoid damaging the optical fibers at the rivet level.
Adjusting the probes
The operational mode of the sensor can be observed at the end of the optical fiber by the presence of a light beam (not dangerous). The light is emitted when the sensor is in mode 1 and not emitted when the sensor is in mode 0. The sensor operates in the near-infrared range to ensure both the power and immunity of the detection function. This also provides an indication of the condition of the optical fiber.
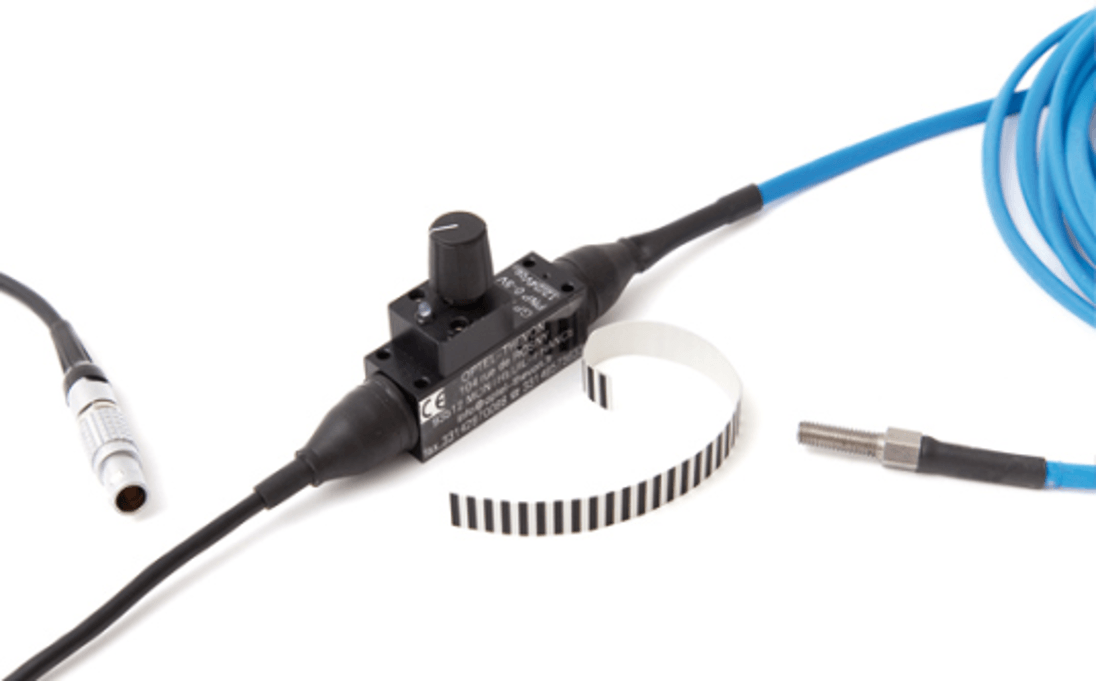
The sensor should be positioned approximately 2 to 5 mm above the tape. A sensitivity potentiometer is available to adjust the trigger level for reliable pulse output.
First, set the potentiometer to the middle position. Bring the probe closer to the target until the indicator light turns on when aligned with the white mark. Then, shift the probe and repeat the operation to detect the triggering limits on the black marks of the target. Finally, set the probe in an average position (distance), and repeat the procedure to confirm accurate detection. Once confirmed, the setup is complete.
Automatic gap detection
When applying black-and-white tape to a rotating shaft, irregular rasterization can occur at the transition point. This irregularity can be used as a zero pulse to indicate a defined start position. However, it may also result in an RPM drop or spike in the measurement.
A software procedure automatically measures the pulses per revolution and detects the exact gap length, ensuring robust and high-quality measurements.
Sensor set-up
The power supply must be perfectly rectified, filtered, and consistently deliver more than 120 mA at 12 V. This is not an open-collector output sensor but a PNP output type. The 152 G7 can support reverse voltage, though this voltage modifies the signal’s amplitude. The 152 G7 TTL voltage output is 5 VDC, while the standard voltage output is the nominal input voltage minus 1.5 VDC.
When connecting the sensor to the acquisition system, the use of dedicated measurement connectors and matching cables is recommended. Please avoid extending the cable, as this may affect the sensor’s operation.
To confirm that the sensor is active, check whether a faint red LED glows on the small light channel in front of the sensor’s optical head. Alternatively, you can use a digital camera to view the infrared (IR) light. The brightness of this small red light is independent of the potentiometer’s position.
Sensor plug-in
V rating: 12/24 Vcc
V Min: 10 Vcc
V Max: 30 Vcc
I: 120 mA/12Vcc
Electrical specifications
Lemo connector
Connector type: L1B7f
Physical diagram
Sample rate
We need to detect the frequency drop so that the gap can be identified, allowing the software to calculate the start and stop of the angle (0 to 360°). If the sampling rate is lower than the input frequency of the TACHO probe, the gap may be missed.
Let’s assume we have about 64 pulses per revolution and the machine is running at 1000 RPM.
1000 RPM/60=16 RPS=16 Hz1000 \, \text{RPM} / 60 = 16 \, \text{RPS} = 16 \, \text{Hz}1000RPM/60=16RPS=16Hz
Therefore, in one second we would get: 16 Hz×64 pulses/rev=1024 Hz input frequency16 \, \text{Hz} \times 64 \, \text{pulses/rev} = 1024 \, \text{Hz input frequency}16Hz×64pulses/rev=1024Hz input frequency.
In the example below, the sampling rate was set to 1 kHz, which resulted in the gap not being recognized at every revolution. In this case, the sampling rate must be at least twice the input frequency.
1024 Hz×2≈2 kHz1024 \, \text{Hz} \times 2 \approx 2 \, \text{kHz}1024Hz×2≈2kHz.
Since the machine speed could increase, it is also important to consider this in the configuration. To ensure reliability, the sampling rate should be set to at least 10 kHz.
To measure RPM and the angle of rotating machines, we need angle sensors. RPM and angle measurements are essential in applications such as balancing, order tracking, and rotational or torsional vibration analysis.
It is important to choose an RPM sensor that is suitable for the specific measurement. Not all sensors can be easily installed on a rotating system, and in some cases, installation may require significant effort. In addition, the sensor must provide adequate resolution for the intended purpose. For example, a sensor that generates only one pulse per revolution is not suitable for precise angle measurements.
A tape sensor is an optical sensor used for measuring speed and angle. It relies on black-and-white tape attached to the rotating part of a machine.
The sensor is made of optical fibers and should be positioned about 5 mm (or less) above the tape. A sensitivity potentiometer must be used to adjust the trigger level to ensure stable pulse generation. The reflected signal is then converted by an electronic circuit into a TTL signal. The sensor is connected directly to a LEMO counter input.
The tape sensor can be used in many applications, including:
RPM measurement
Angle measurement
Order tracking
Rotor balancing
Rotational and torsional vibration
Tape sensor setup
First, glue the tape with black and white stripes onto the rotating part. If both ends of the tape are joined perfectly, there will be no zero pulse per revolution, which indicates the start position. Without this start position information, the measured angle would differ at the beginning of each measurement.
In the image above, we can see the transition point of the tape, which is used as the ZERO pulse. This marks the beginning of a new revolution, ensuring that the angle always starts at the same position. As a result, the angle information related to the shaft remains consistent.
In the image below, we can see the frequency drop that occurs at the zero pulses. This drop is clearly visible and can be used to detect the ZERO pulse. The angle will always restart at this position. For the software to reliably detect this drop or peak, the gap length must be more than three pulses. With such a gap, the software can easily detect the ZERO pulses because the frequency decreases by approximately 70%.
We must adjust the trigger levels to obtain reliable pulses from the optical sensor. The trigger level should be set after the sensor is mounted, as it depends on the distance to the tape.
The sample rate must be high enough to detect the frequency drop so that the gap can be observed and the software can correctly calculate the start and stop of the angle.
Example:
If we have 64 pulses per revolution and the machine is running at 1000 rpm:
1000 rpm/60=16 Hz1000 \, \text{rpm} / 60 = 16 \, \text{Hz}1000rpm/60=16Hz
Input frequency = 16 Hz×64 pulses/revolution=1024 Hz16 \, \text{Hz} \times 64 \, \text{pulses/revolution} = 1024 \, \text{Hz}16Hz×64pulses/revolution=1024Hz
If the sample rate is set to only 1 kHz, the gap may not be recognized at every revolution.
Defining sensor type
When performing an RPM measurement, we must select Sensor mode in the Counter setup in Dewesoft.
Once Sensor mode is selected, we choose our sensor from the Counter sensor database, where various types of sensors and their settings are already stored.
If we are using a sensor that is not yet included in the Counter sensor database, we need to define it manually.
To do this, go to Settings → Counter sensor editor, or simply click on the three-dot button to open the Counter sensor editor.
In the Counter sensor editor, we add a Tape sensor as the sensor type. I renamed it Tape sensor. When we click Save & Exit, the sensor is added to the Counter sensor database and is ready for use.
For these sensors, we need to define the number of pulses per revolution (number of lines) and the gap. The last white line marks the start of the gap. For example, for a tape sensor with 200 white lines and a gap consisting of two missing white lines, the number of teeth is 199 (200 – 1), and the gap is 3 (1 + 2 missing teeth).
We created a tape sensor that can now be selected from the drop-down menu in the counter channel setup.
For precise measurement, we need to know how many pulses per revolution are generated by the tape sensor and how many pulses are in the gap width. We should not count this manually, as there is a function called Detect Gap that automatically measures the pulses per revolution and detects the gap length.
For accurate gap length calculation, the RPM should be as stable as possible. Try to operate the machine in a stable range so that rotational vibration (RPM deviation) is minimized.
The algorithm averages the machine speed a few samples before and after the gap. From this average speed around the gap, the missing pulses can then be calculated.
Measurement results
The output channels of tape sensors are angle and frequency channels. The angle channel runs from 0° to 360°, while the frequency channel can be displayed in either RPM or Hz.
In the recorder, we can observe the angle in the range of 0° to 360°. When the tape is rotating, the angle value increases, and when the ZERO pulse is passed, the angle resets to 0. The frequency channel is shown in RPM. The RPM channel (green curve) is not a straight line because the rotor was not balanced. This demonstrates that the tape sensor can also be used for balancing rotary parts.
Measurement accuracy
The overall error of the measurement must be divided into errors from the sensor and the counter measurement uncertainty. In most cases, sensor errors account for the majority.
Counter accuracy
Counter architecture
To understand how angle resolution is determined, it is first necessary to review the internal architecture of Dewesoft counters. Internally, a combination of a main counter and a sub-counter is used to achieve higher precision in frequency measurement.
The main counter operates in event counting (or encoder) mode. The sub-counter is used for time measurement, recording the exact time of the input event with a resolution of 9.77 ns (1 ÷ 102.4 MHz), relative to the sample clock. At every rising edge on the counter source, the sub-counter value is stored in a register. At each sample clock, the values of both counters are read.
With this approach, not only can frequency be calculated precisely, but the event counter result can also be expressed in fractions, since the exact time of the input event is known. The event counting result is recalculated using interpolation to align with the sample point, as illustrated in the diagram below.
The improvement in measurement results is clear: while a standard counter input displays values with up to a one-sample delay, the Dewesoft counter input calculates the exact counter value directly at the sample point.
Angle resolution
The counter result is read at the sample rate; therefore, the calculated angle updates at the same rate.
Furthermore, the angle resolution depends on the rotational speed (RPM).
Below are two angle-based 2D graphs showing the sensor angle on the x-axis at the same RPM. The option “draw sample points” was enabled. On the left, the sample rate was set to 500 Hz, while on the right, it was set to 2500 Hz:
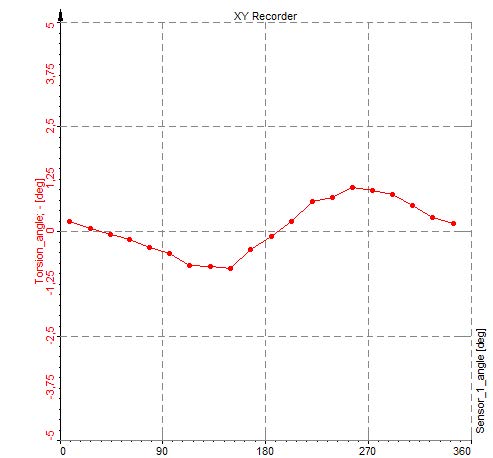
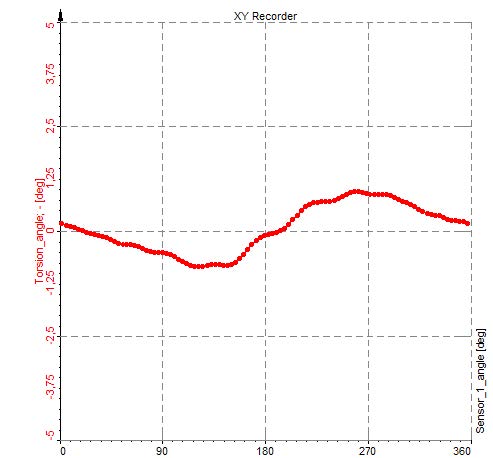
Since rotational and torsional calculations are based on the sample rate, the angular resolution remains the same.
Angle accuracy
Since the counter operates on an internal time base of 102.4 MHz, the angle accuracy depends only on the rotational speed (RPM).
The following formula shows how to calculate the angle accuracy:
The numerator represents the angle that passes in one second. This value is then divided by the time base of the counter (in our case, 102.4 MHz). Therefore, within one second, the system provides 102.4 million samples.
Frequency accuracy
Any digital frequency measurement is based on period time measurement. The time between two edges of the input signal is sampled with the counter time base of 102.4 MHz. With this simple measurement method, the accuracy of the measured frequency is defined by the ratio between the input signal frequency and the counter time base frequency.
We can see that the error increases with the input frequency. For example, at 10 MHz the accuracy decreases to about 10%.
As explained above, the advanced counter structure of Dewesoft uses two internal counters, and the output rate is synchronized with the acquisition rate. With this technology, the maximum error can be limited to the set acquisition rate.
The illustration below shows the accuracy at different input signals between 2 kS/s and 1000 kS/s, also taking into account the typical counter time base accuracy of 5 ppm.
Signal frequency is shown on the X-axis, and the acquisition sample rate is displayed on the right side of the graph.
The blue curve in the graph represents the formula described above.
If we measure with a sample rate that is higher than the frequency of the signal, the frequency is calculated using only one period. If the sample rate is lower than the signal frequency, the frequency is calculated once per sample.
Example: If we measure a 10 MHz signal with a sample rate of 1 MS/s, we obtain an average frequency every microsecond, based on the last 10 periods. The error will be the same as if we were measuring a signal that is 10 times slower. This is why a straight line appears on the upper right side of the graph.
This inaccuracy also depends on the type of sensor, which is not included in the formula. The formula assumes the sensor is infinitely accurate. However, some sensor types have poor resolution and generate significant noise. The graph assumes a typical inaccuracy of 5 ppm, which is also represented at the beginning of the graph.
Angle sensor comparison
When measuring angle, it is critical to select the appropriate sensor to ensure accurate results.
| Angle sensor | Pros | Cons |
|---|---|---|
| Encoder | best resolution useful also for low RPMs | mounting is critical |
| Tacho sensor | easy installation cheap | bad resolution not useful for TV and CA |
| Tape sensor | easy installation good resolution zero position | expensive |
| CA-RIE encoder | best for high RPM vibrations | extensive installation |
DS-TACHO 1
DS-TACHO1 is a tacho adapter that converts an analog tacho signal to a Dewesoft instrument’s CNT/DI input (Lemo 7-pin) with an adjustable trigger level (TTL logic signal).
It fits the COUNTER input (Lemo 7-pin) on DEWE-43 and SIRIUS ±100V isolated inputs, with an adjustable trigger threshold from ±10 mV to ±2 V.
Tacho Adapter – Electronic Specifications Table:
How does it work?
Connect the DS-TACHO1 via the Lemo 7-pin connector to a DEWE-43 or SIRIUS counter input, and connect the DSUB 9-pin side to your analog tacho probe signal (e.g., a magnetic pick-up sensor with a screw, 1 pulse per revolution).
Start the rotating machine, then use a screwdriver to manually adjust the trigger level on the DS-TACHO1 (see picture below).
When the trigger is detected correctly, the blue LED will flash. Vary the machine RPM to verify that the trigger level is suitable across the full RPM range.
The lowest detectable frequency for the counter input on the DEWE-43/SIRIUS is 5 Hz. Therefore, with 1 pulse per revolution, the lowest measurable RPM is 300. If you need to measure lower RPM, you can increase the number of pulses per revolution (e.g., by mounting a screw every 90° on the rotating disk when using an inductive probe, then dividing the result by 4).
The image below shows the input signal of a magnetic tacho probe (coil) as a screw passes by on the disk. As the RPM increases, the induced voltage also increases. In this case, you need to set the trigger level low (±10 mV in the example shown).
The upper (red) line represents the trigger level, and the lower (orange) line represents the retrigger level. The signal must fall below the retrigger line to re-arm the circuit for the next trigger. This mechanism even allows correct detection of a weak or noisy signal, as shown in the example above.
How to calculate the maximum possible RPM for your sensor
To reliably measure gap sensors (gear-tooth or tape), we need to set the correct sampling frequency for acquisition. The theoretical Nyquist multiplier factor is 2.56, but we recommend using a factor of 5 or even 10 to ensure accurate signal edge detection. This, in turn, limits the maximum RPM range in relation to the number of pulses per rotation.
To calculate this limit, you can use the following formula:
Calculator for Maximum Analog RPM Acquisition:
Page 1 of 26