

What You’ll Learn 📊
Understand the Dewesoft Historian architecture: Measurement Units, MQTT broker, InfluxDB, Grafana, and client plugins
Install and configure the Historian server stack using Docker: MQTT broker, InfluxDB, Grafana Connector, Grafana, and Dewesoft plugins
Set up and customize Data Publisher and Subscriber channels in DewesoftX’s Historian Client plugin
Secure communications using MQTT and MQTTS (certificates, ports, authentication)
Visualize live and historical data in DewesoftX via Historian Client and Historian Importer
Create Grafana dashboards: trend charts, annotations, Zoom control, and 2D vector plots for FFT/scope data
Manage data retention policies in InfluxDB: optimize storage with multiple sampling rates & data aging strategies
Course overview
The Dewesoft Historian: Installation and Usage course guides engineers through implementing a robust data-logging and visualization system using DewesoftX and open-source tools. Starting with a clear overview of the system architecture—including MQTT communication between Measurement Units, the server-side InfluxDB and MQTT broker, Grafana for visualization, and Dewesoft Historian plugins—you’ll first learn how to install the full stack via Docker, configure license access, and handle network/firewall settings.
You’ll then dive into DewesoftX’s Historian Client plugin in Measure mode, which allows publishing selected measurement channels to MQTT. You’ll configure Publisher and Subscriber tabs: select channels, set Broker IP/port, assign unique client IDs, and optionally enable MQTTS encryption with certificates . The Historian Importer in Analyze mode enables importing time-range historical data from InfluxDB back into DewesoftX for offline review.
Finally, the course covers Grafana dashboard creation—from trend lines and annotations to advanced vector 2D plots for FFT and scope-type data—and explains setting multi-tier data retention policies to optimize month-to-year storage resolution.
By the end, you’ll be fully equipped to deploy and manage a scalable, secure data historian system with live dashboards and long-term storage—unlocking powerful monitoring and analysis capabilities in both DewesoftX and web clients.
Dewesoft Historian
Dewesoft Historian is a DewesoftX plugin solution that enables continuous measurement and storage into a database from Dewesoft Measurement Units. It also provides access to the database via a web browser or DewesoftX software. Dewesoft Historian consists of several software components, which typically run on different systems—such as measurement units, servers, and client PCs.
Measurement units, databases, and clients within the Dewesoft Historian system communicate using the MQTT protocol, allowing each component to operate on a separate computing system at any location with internet access.
Essential requirements:
DewesoftX software
DewesoftX evaluation license
Resources
Docker Desktop
Dewesoft Historian Docker Package
Dewesoft Historian Manual
MQTT protocol
Before we begin this training, it is essential to have at least a basic understanding of how the MQTT protocol works. This knowledge will help you better understand the operation of the Historian system.
In the MQTT protocol, communication is established between two main entities: the publisher and the subscriber, both connected through a broker.
The broker routes messages from the publisher to subscribers.
Publisher sends messages to the broker
Subscriber listens for messages from the broker
The Historian Client plugin can function as both a publisher and a subscriber on the same system. However, in a typical use case, one instance is used solely as a publisher, and another instance is used solely as a subscriber.
System overview


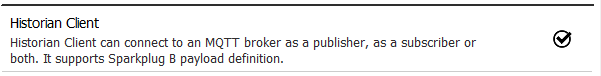
Historian Client is a DewesoftX plugin running on a measurement unit. It is used to publish or subscribe the data, using the MQTT protocol, to/from the MQTT broker.
MQTT broker is the central component that temporarily holds the data published by Historian Clients running on the Measurement units and serves the data either to the MQTT client subscribers that can be either Influx consumer service or Historian Clients (DewesoftX instances).
Influx consumer service subscribes to the MQTT broker and sends the data to the InfluxDB database, where the data is permanently stored.
InfluxDB time series database permanently stores the data. InfluxDB is a leading time series database solution designed with measurement applications in mind. Its open source version is used within the Dewesoft Historian solution.
DewesoftX Historian PC Client is an instance of Dewesoft software that runs on client PCs and includes two plugins: Historian Client and Historian Importer. Historian Client plugin operates in Dewesoft’s Measure mode and has the role of displaying live data from the measurement units.
Historian Importer plugin operates in Dewesoft’s Analysis mode and allows the user to load historical data from the database into a Dewesoft .dxd data file for analysis.
Grafana GUI is a visualization platform for measurement data that runs in a web browser. Its open source version is used within the Dewesoft Historian software solution. In its simplest form it only requires the Grafana Core installation running on the server which allows users from any web browser to connect to and visualize the data from the database. However, Dewesoft Historian license package includes the following enhancement of the solution:
Dewesoft Grafana plugins which provide user interfaces not available in a standard Grafana such as 2D graph (called Vector) to display FFTs and similar data channels.
Installation
To enable the Dewesoft Historian Client, follow these steps:
Open DewesoftX and navigate to Options (upper right corner).
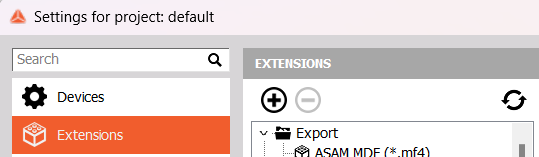
Go to Settings and select Extensions.
Search for “Historian Client” in the list of extensions. If the plugin is not listed, click the + icon at the top.

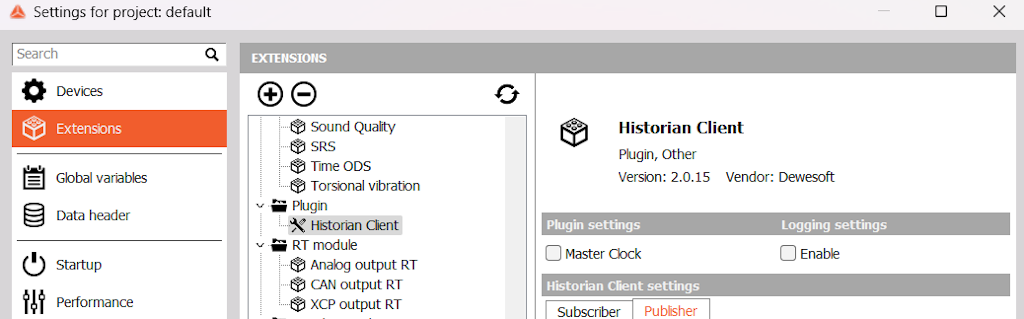
Change the filter to “All” and search for Historian Client in the list. Enable it, and the plugin should now be activated.

Configuration
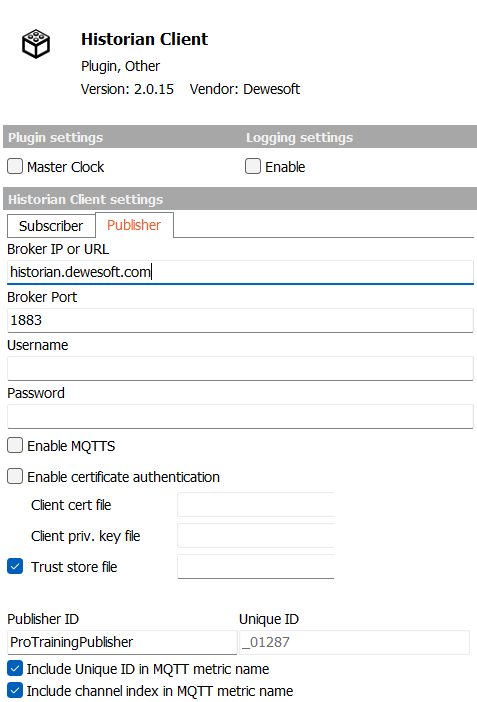
After a successful installation, the Dewesoft Historian Client should appear in the list of extensions. Select it to open the Historian Client settings.

First, we need to configure both the subscriber and the publisher with the correct broker URL or IP address and port. Setting the subscriber to the correct IP address determines where the data will be received from. Conversely, configuring the publisher specifies where to send (or publish) the data, ensuring that measurements or messages are properly transmitted to the designated broker for distribution to subscribers. This configuration establishes clear communication paths in the data flow process.
Subscriber setup
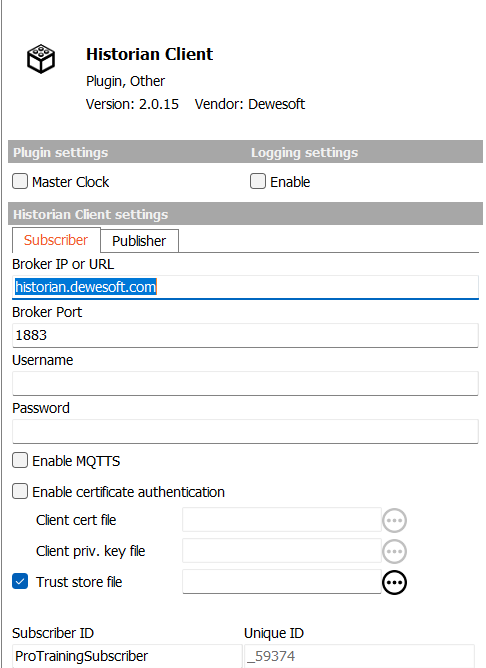
The subscriber listens for messages from the broker on specific topics. To configure it, follow the instructions below:
set Broker URL/IP to historian.dewesoft.com
set Port to 1883
set Subscriber ID to ProTrainingSubscriber
Optionally username and password if required by the broker. (not required on historian.dewesoft.com)

Publisher setup
The publisher sends messages to the broker on specific topics, which are then delivered to subscribers. To configure it, follow the instructions below:
set Broker URL/IP to historian.dewesoft.com
set Port to 1883
set Subscriber ID to ProTrainingPublisher
Optionally username and password if required by the broker. (not required on historian.dewesoft.com)

Once the Historian Client plugin is enabled and configured, switch DewesoftX to Measure mode and open the Channel Setup. The Historian Client icon should then appear.

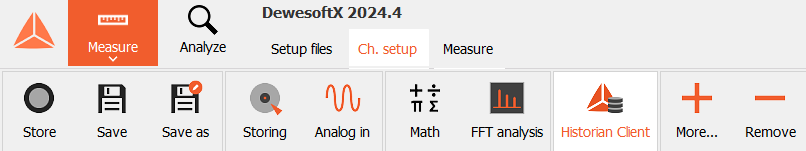
Now, we can appreciate the simplicity and versatility of the Historian plugin. It is divided into two main components:
Subscriber section displays a list of all channels published to the Historian MQTT broker. Here, users can easily subscribe ( select ) to any offered data channel being transmitted by different publishers.
Publisher window allows users to create publishing channels within the same plugin for data transmission.
Create a publisher channel
Now, let’s create a simulated publisher channel!
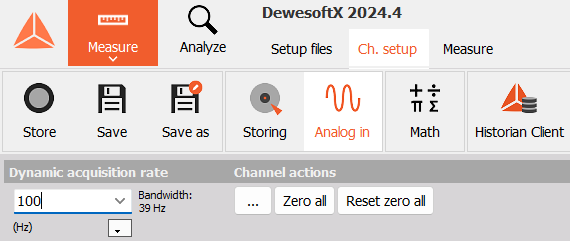
First, open the "Analog In" section in the channel setup and set the sample rate to 100 Hz.

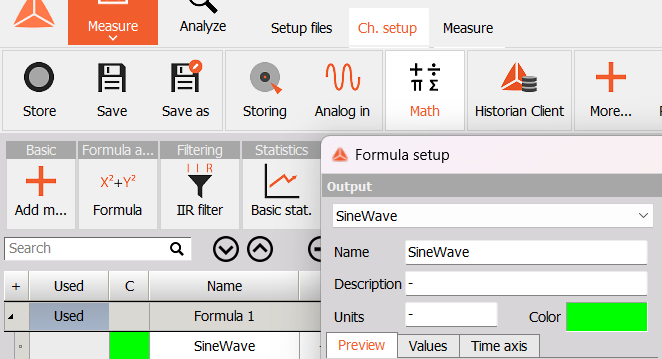
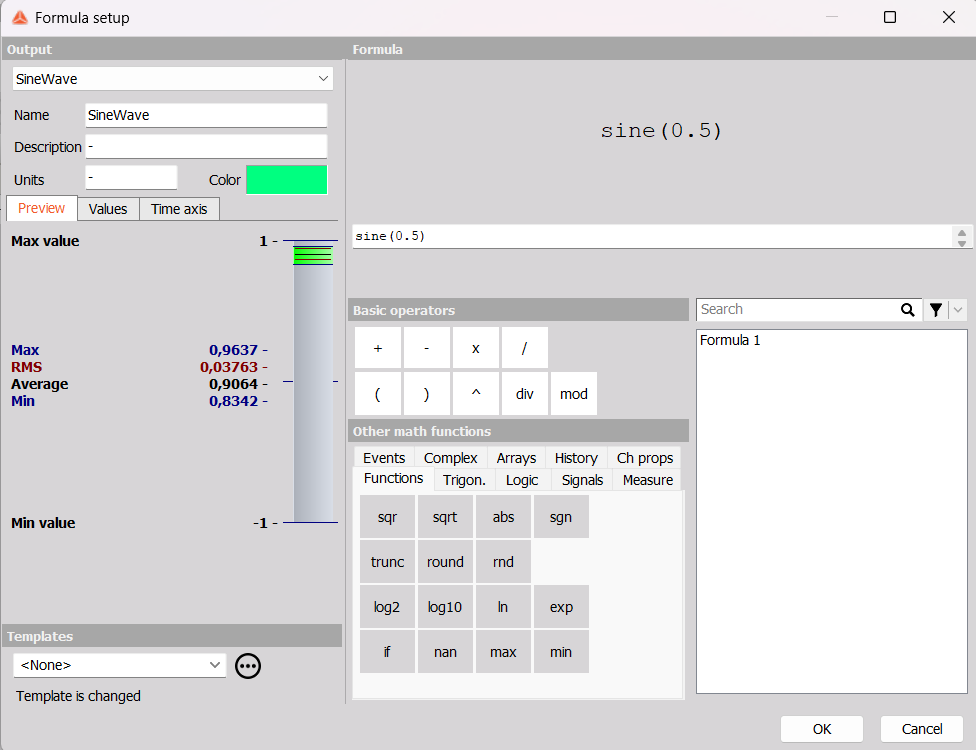
To create a simulated measurement, open the "Math" section and add a Sine Formula channel to simulate a sine wave. Once this step is complete, confirm the creation of your simulated measurement channel.


Next, switch back to the Publisher section in the Historian Client plugin. Your newly created simulated measurement channel should now be visible.

Let’s go live!
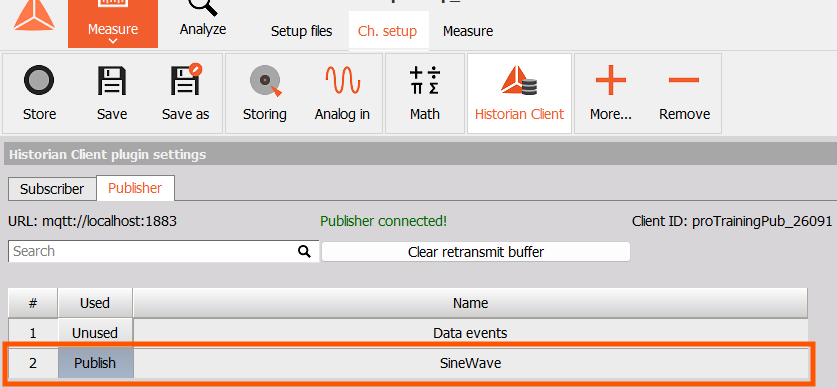
The final step is to start publishing data from your measurement channel. Locate your simulated measurement channel in the list of publishers and enable it by clicking the button in the "Used" column. Once the button changes to "Publish," navigate to the "Measure" window, where you should see your simulated sine wave.

You are now live, and your channel should be sending data to the broker on the server.
Monitor your published channel
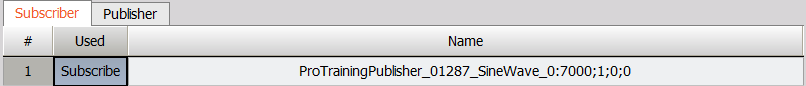
Your published simulated channel is now up and running. The next step is to subscribe to it (i.e., to read the data). Since both the Subscriber and Publisher are configured with the same broker URL/IP, your simulated channel should now appear in the Subscriber tab of the Historian Client.

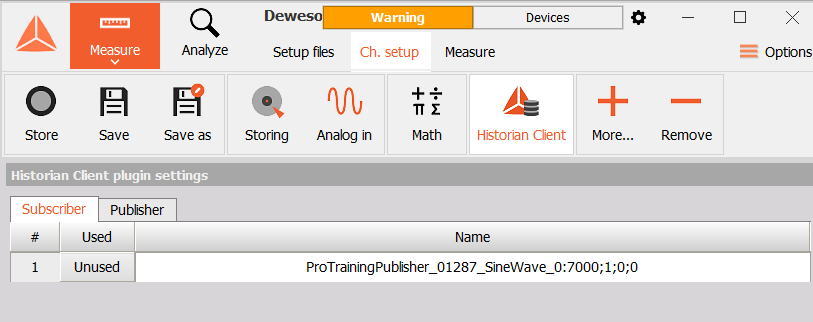
To subscribe to your simulated channel, locate it in the channel list and enable it by clicking the button in the "Used" column. Once the button changes to "Subscribe," you will begin receiving data from the publisher through the broker in real time.

Visualize subscribed channel in DewesoftX
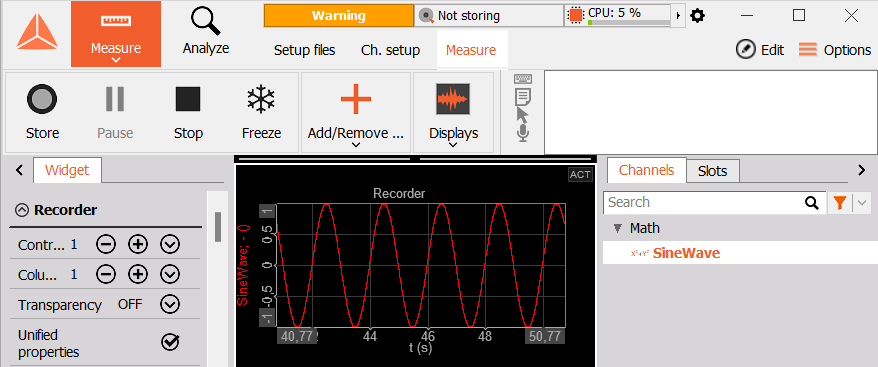
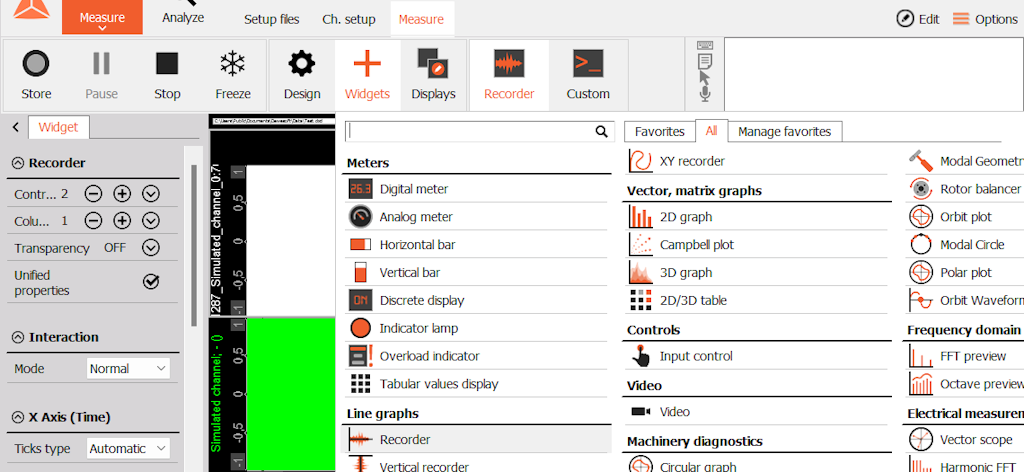
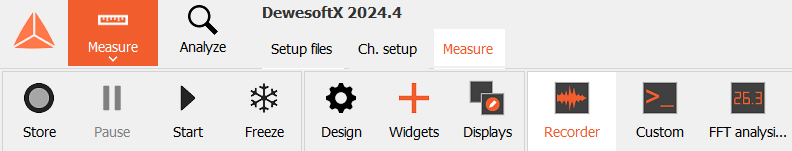
Once you're subscribed to your simulated channel, the fetched data needs to be visualized. With the channel active (subscribed), open the Measurement section. To visualize live data, use the Recorder tool. By selecting "Recorder," graphical visualizations for all active channels should appear automatically. If this does not occur, you can manually add a recorder by opening the Widgets menu and selecting "Recorder."

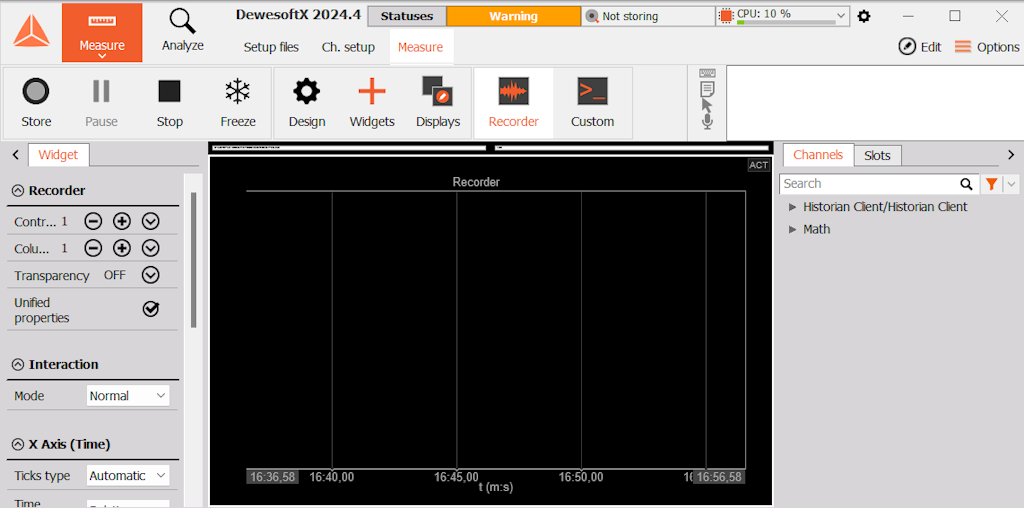
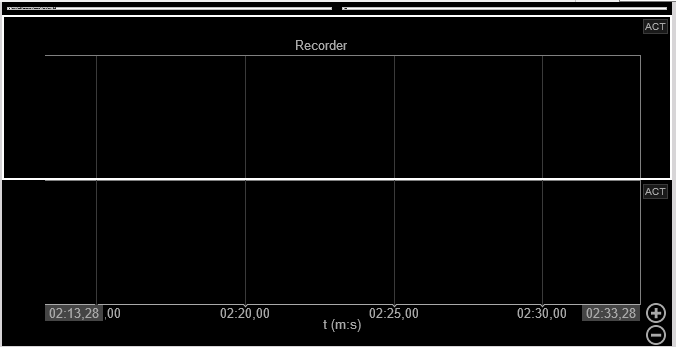
Recorder
Once the Recorder window is open, it can be divided into three vertical sections:
Recorder Settings (leftmost section)
Graph Section
Channel Selection Section

Make sure you are subscribed to the channel you have published. You should now have two active instances of the same channel:
The first instance is your local simulated sine wave, which runs directly in DewesoftX.
The second instance is the same sine wave, but now the data flows through MQTT. This means that the sine wave data is published from DewesoftX to the MQTT broker, and then subscribed back into DewesoftX.
To display both the subscriber and local instances of the channel, go to the Channel Selection section and switch to the Channel tab. You should see your channels divided into two groups:
Math Group: This contains all your local math channels, including your local simulated sine wave channel.
Historian Client: This contains Historian Client channels.
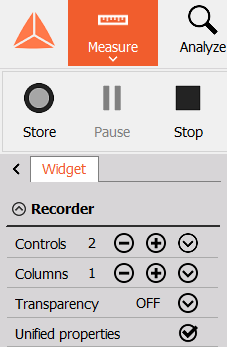
To compare the local channel with your published channel, you’ll need two recorder widgets. If only one is currently displayed, go to the Controls section and use the "+" or "−" buttons to add or remove recorders as needed.

Your display should appear similar to the following:

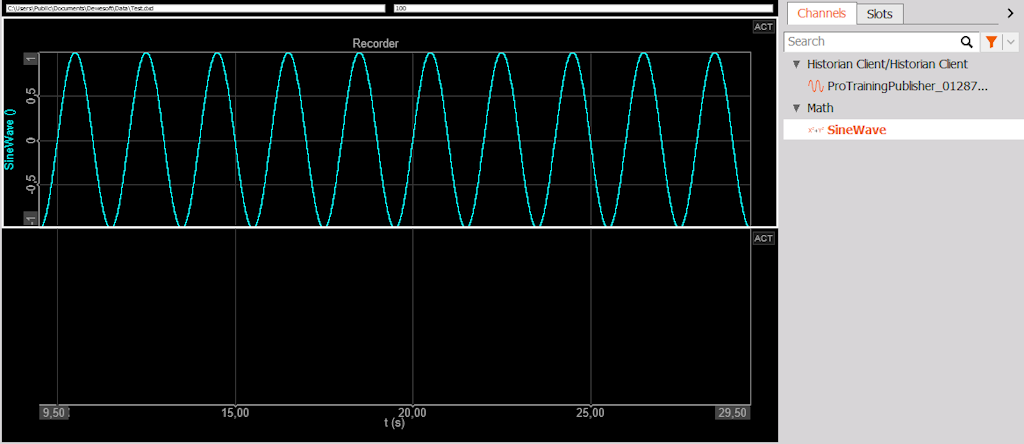
As discussed earlier, both your local and subscriber channels are located in the Channel Selection section. To add a channel to a recorder, follow these steps:
Select the Recorder: Click directly on the recorder you wish to use. You will know it is selected when a wider white border appears around it.
With the recorder selected navigate to the Channel Selection Section. In the Math section of the Channel Selection, find your simulated sine wave channel and select it (When the background of the channel name turns white, it means the channel is selected.)
At this point, your selected recorder should display your local simulated sine wave channel and should appear similar to the following:

To add your subscribed channel to the second recorder, follow the same steps. The final result should appear as follows:

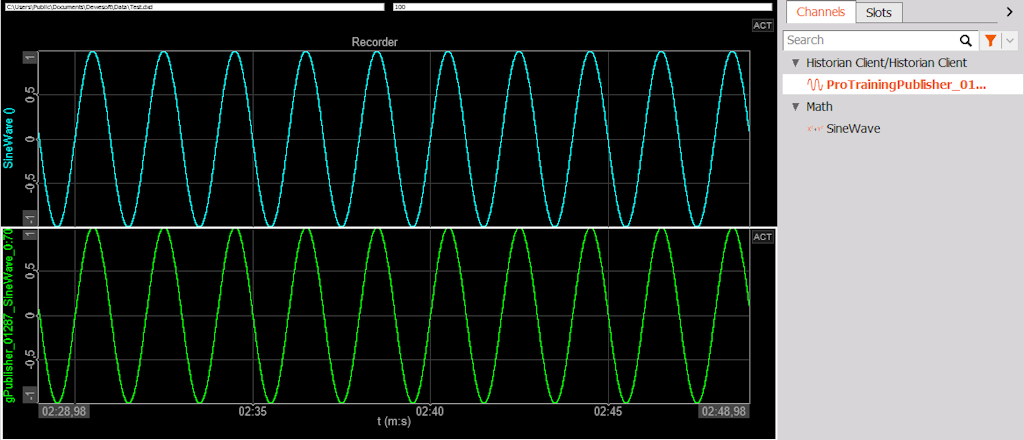
If we now examine the final result, we can clearly observe our local instance of the simulated sine wave channel running alongside the same instance, which is being published by the publisher to the broker and then retrieved by the subscriber back into DewesoftX.
DewesoftX Historian importer
As discussed in previous chapters, when using the Dewesoft Historian Client plugin, data bypasses the database by default, flowing directly from the publisher, through the broker, to the subscriber. In parallel with this direct stream, another connection runs simultaneously to store real-time data into the database.
For more advanced analysis, DewesoftX’s Analyze mode offers a comprehensive set of tools. Since the measurements are stored in a database, the Historian Importer allows you to retrieve this data and convert it into the native .dxd format. Once the data is imported locally into DewesoftX, you can take full advantage of its advanced analysis features for detailed and thorough examination.To access the database, you need the URL or IP address of the server. To try the Dewesoft Historian Importer, you can use the following address: https://historian.dewesoft.com:8082.
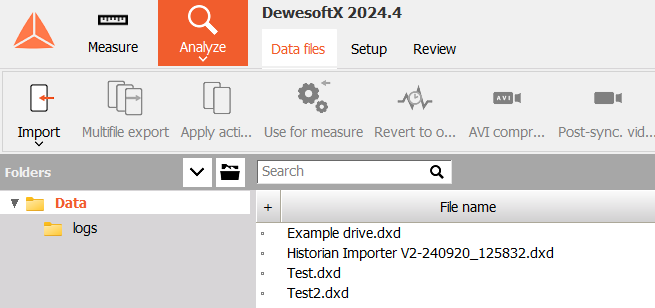
To import data using the Historian Importer, DewesoftX must be in Analyze mode. Click the Import icon to open the drop-down menu, then select Historian Importer.

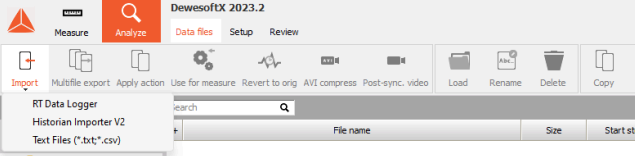
After selecting the Historian Importer, the Historian Importer window will appear. In this window, you can configure and manage various options related to the data import process.

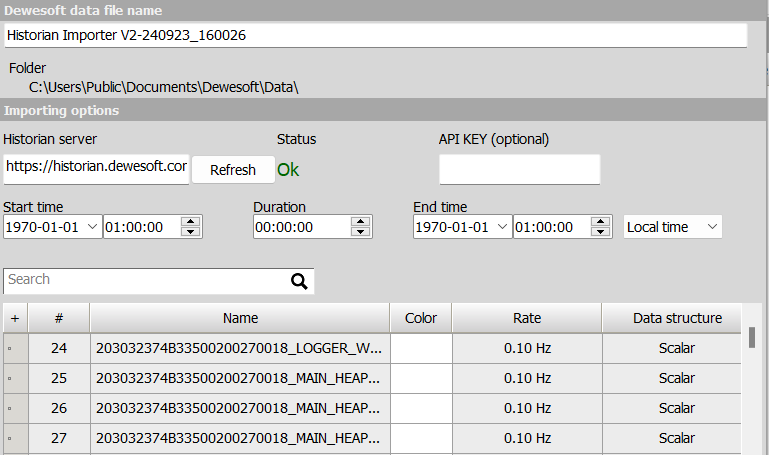
The most critical configurations involve selecting the correct database address and ensuring a successful connection.
Public Historian Server: Set the server to "https://historian.dewesoft.com:8082" to connect to the public Historian server database.
Local Historian Server (Docker): If you're running Docker locally, set the server to "https://localhost:8082" to connect to your local Historian server database.
Once the address is configured, additional settings include:
Status: After entering the Historian server IP and clicking Connect, green "OK" letters will appear if the connection to the database is successful.
Start time: Select the start time and date of the data you want to import.
End time: Select the end time and date of the data you want to import.
API key: You may also set an API key for authentication if required by your server. Ensure that you have the correct API key to access the database.
After configuring the importing options, select the channels you’d like to import from the database. This can be done using the table located below the importing options. The table displays the name, rate, data structure, and data type of all channels stored in the database.

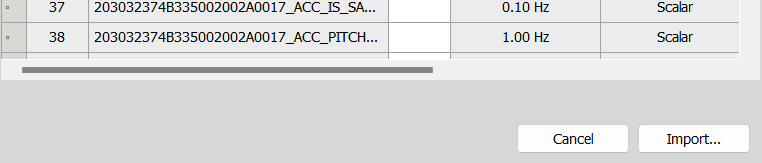
After selecting the channels you’d like to import, click the Import button. A new data file containing the selected channel data will be created. Once the import is complete, Analyze Mode should open automatically. If it doesn’t, you can manually view and open your imported files by navigating to the Data Files section, where all your .dxd files are stored, and selecting the imported file. By default, files imported via the Historian Importer are saved under the name "Historian Importer."

Congratulations! You’ve successfully used the Historian Importer to fetch the selected channel data from the database. While data analysis is beyond the scope of this training, we strongly recommend exploring our Data Analysis Training for a deeper understanding of how to analyze your imported data.
Setup your own server
Up to this point, we have been using Dewesoft’s public Historian server (historian.dewesoft.com). However, Dewesoft also offers the ability to set up your own private server, which can run an MQTT broker, an InfluxDB database, and a Grafana web client.
In this part of the training, we’ll walk through how to set up and configure your own private server. So, let’s roll up our sleeves and turn your computer into a fully functioning Historian server!
Challange: setup your own server
Congratulations on making it this far in the Dewesoft Historian training! By now, you should have a solid understanding of MQTT. Let’s return to the section where we configured the subscriber and publisher in the DewesoftX Historian plugin.
Your next challenge is to replace the public Historian broker with the one running in the Docker container on your local machine.
Database
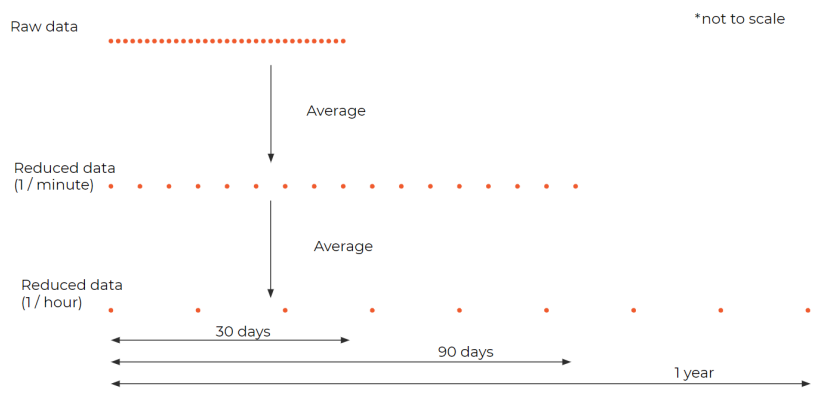
Data retention policies
The Influx database includes an automatic procedure that can reduce the amount of stored data after a specified period. For example, data may initially be uploaded to the database at 10 samples per second (S/s), but after one month, every 10 samples can be averaged, reducing the data rate to just 1 S/s.
The figure below illustrates this data reduction process graphically.

Grafana web client
If you've successfully set up your own private server and explored the Docker processes, you’ve likely discovered that the Historian system also includes a web-based solution for data visualization called Grafana. Grafana is an open-source analytics and monitoring tool integrated into the Historian system, making it an ideal platform for viewing and analyzing data without relying on DewesoftX software.
Setup
We learned that processes running locally can be accessed using "localhost" instead of an IP address. Since our local instance of Grafana runs on port 3000, you can access it by opening your browser and entering localhost:3000. If the Docker container is running, the Grafana interface should load, and you will be prompted to enter a username and password.
By default, the credentials are "admin/admin", but for security reasons, you will be required to change them upon your first login.
Before setting up Grafana, you need to ensure that the data channel is active, running, and being published to your local broker. Refer to the “Configuration” section and set both the publisher and subscriber IP addresses to “localhost.” After updating the broker location from the public Historian server to your local broker, verify that your simulated channel is being successfully published.
To confirm that your data is active, switch to Measure Mode in DewesoftX. A graphical visualization of your active simulated channel should appear, indicating that everything is functioning correctly.

Leave the DewesoftX window open and switch to your browser.
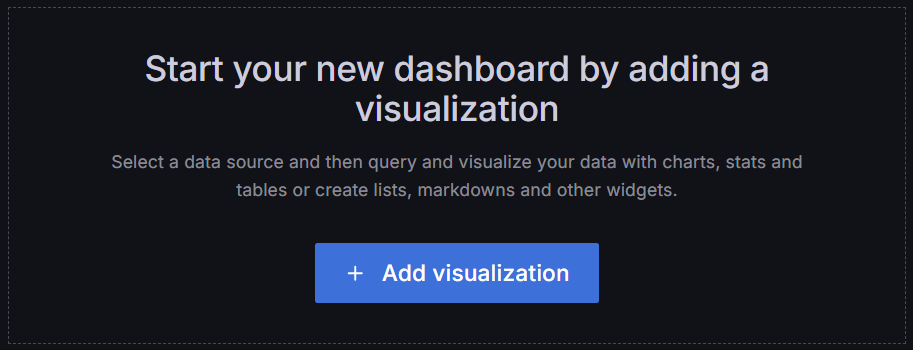
Creating a dashboard
To display the data, a dashboard must be created and a panel added to it. You can create a dashboard by clicking the plus button in the menu, selecting "New Dashboard", and then clicking "+ Add Visualization" in the screen that appears.


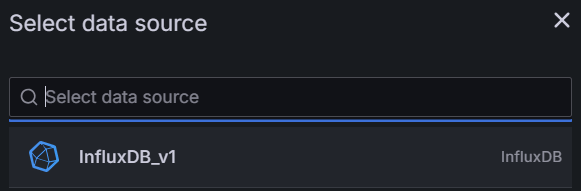
The data source (i.e., the address of the database) is already preset — you simply need to select it.

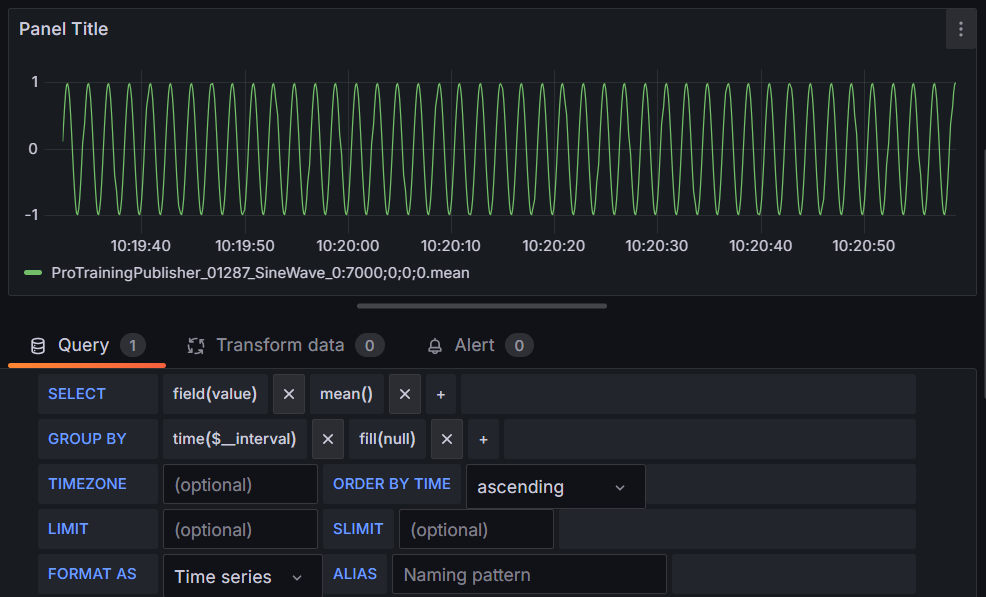
The following view will appear:

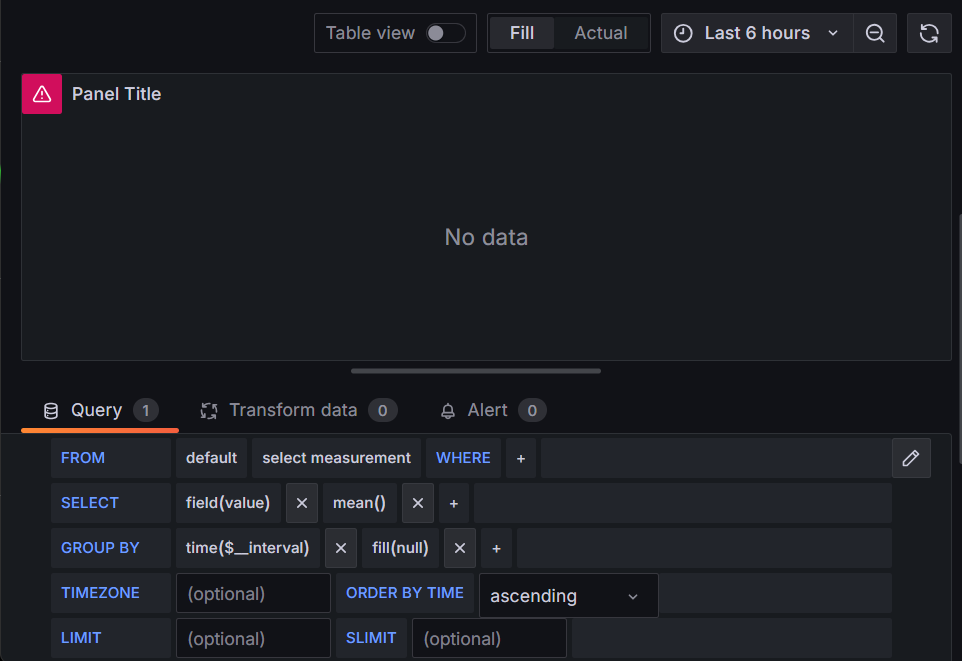
Go to Select Measurement. A list of all channels available for display will appear. The database query is already preconfigured, so all that remains is to select the measurement channel. Your simulated channel should be visible in the list.

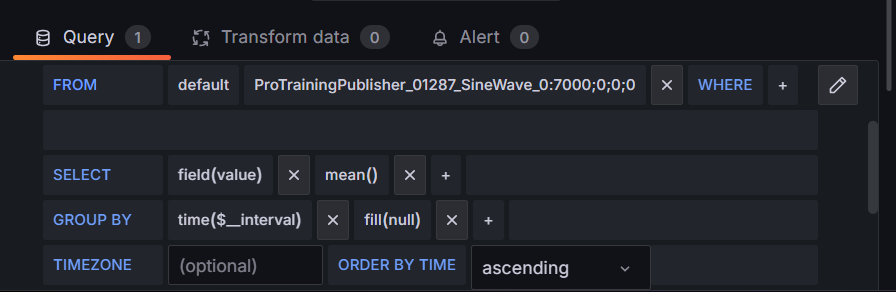
Go to Select Measurement. A list of all channels available for display will appear. The database query is already preconfigured, so all that remains is to select the measurement channel. Your simulated channel should be visible in the list.

Grafana - working with dashboards and panels
Grafana offers extensive options for visualizing and analyzing data. While its official documentation provides a detailed and comprehensive guide for working with Grafana, this manual will highlight key tips specifically for handling measurement data commonly used in Dewesoft Historian applications. These tips will help you get started with basic setups, dashboards, and visualization techniques, focusing on efficiently integrating Dewesoft data into Grafana. For a deeper dive into Grafana’s full capabilities, please refer to its official documentation.
Time axis
In Grafana, the time axis settings and screen refresh rate are controlled using three primary tools located in the upper-right corner of the screen:

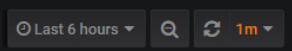
Refresh Button:
The far-right button is used to manually refresh the screen. This can be useful when working with live data or making changes to the dashboard configuration. Additionally, the dropdown next to this button allows you to select the automatic refresh rate, ensuring the data updates periodically.
Time Interval(X-axis):
The far-left button controls the time range displayed on the X-axis (e.g., "Last 5 minutes," "Last 1 hour," "Last 6 hours," etc.). This feature allows you to quickly switch between different time intervals to analyze data over varying periods.
Zooming:
You can zoom in on the time axis by using a click-and-drag gesture directly on the data in the graph, similar to how it is done in Dewesoft software.
To zoom out, you can either click the middle button (reset zoom) or select a different time range using the far-left button.
Color
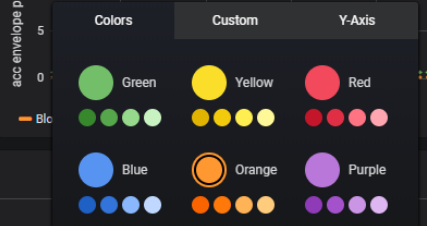
You can change the measurement color by doing the following:
Click on the colored line next to the channel name in the legend at the bottom of the recorder display.
A color picker will appear, allowing you to select from different preset colors.
If you want to use a specific color, select the Custom tab from the color picker to input or select a custom color

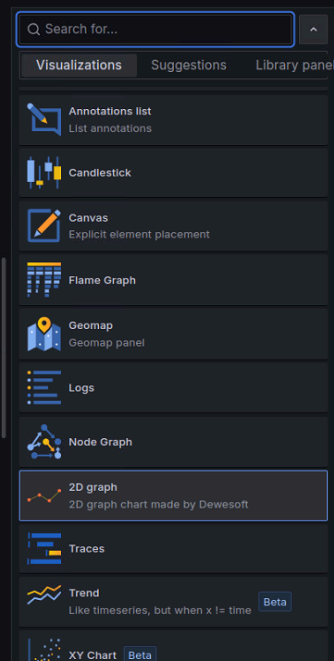
Grafana 2D graph
The Grafana 2D graph plugin, developed by Dewesoft, enables the visualization of vector channels within Grafana. Common vector channels include FFTs and Scope Math channels. This graph functions similarly to the 2D graph in DewesoftX software, providing a familiar and effective tool for data analysis.
To set up a 2D graph in Grafana, begin by adding a new panel and selecting the 2D graph plugin as the visualization type. Alternatively, you can use the preconfigured Default Dashboard included with the package, which already has the appropriate plugin and query selected. To use it, simply duplicate the dashboard and select the channel name configured in the DewesoftX Historian Client publisher, using the suffix _AmplFFT.

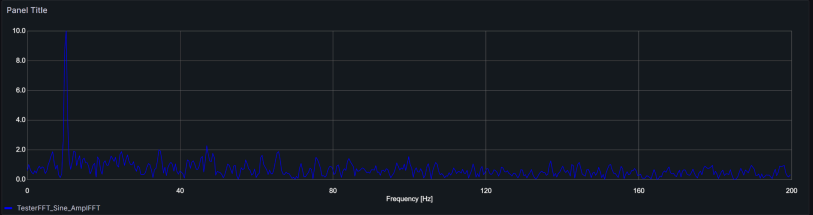
Assign one of the vector channels from the database with the suffix _AmplFFT , and configure the query exactly as shown in the picture below.

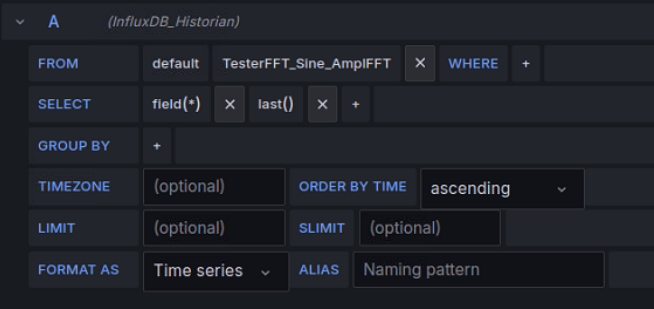
If the query is configured correctly, the 2D graph plugin visualization should appear similar to the example shown below.

Grafana - annotations
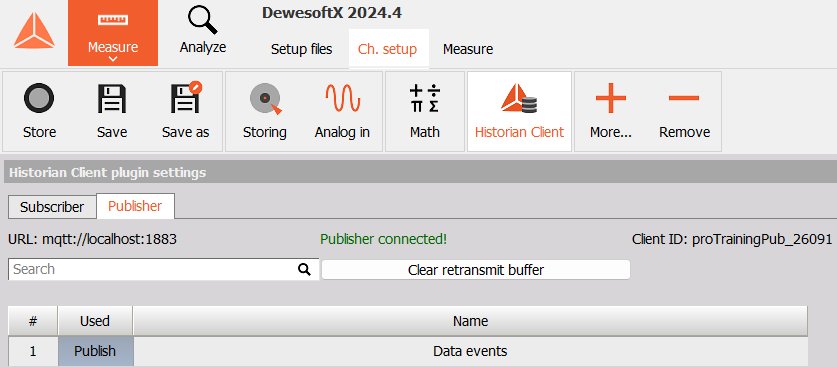
To test Grafana event annotations, we will begin by configuring DewesoftX. Since the "Storing" event is predefined, we will use it as an example.
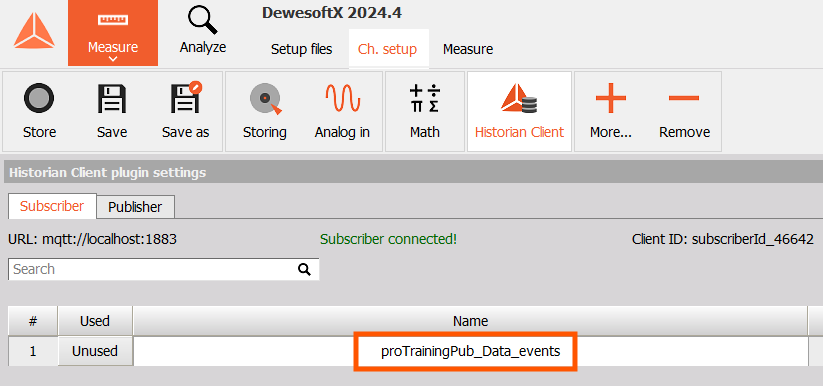
First, open DewesoftX and navigate to the Historian Client Publisher. Locate the Data_event channel and activate it by toggling the button in the "Used" column to "Publish."

Now switch to the Subscriber section, locate your Data_event channel, and make note of its name for later use.

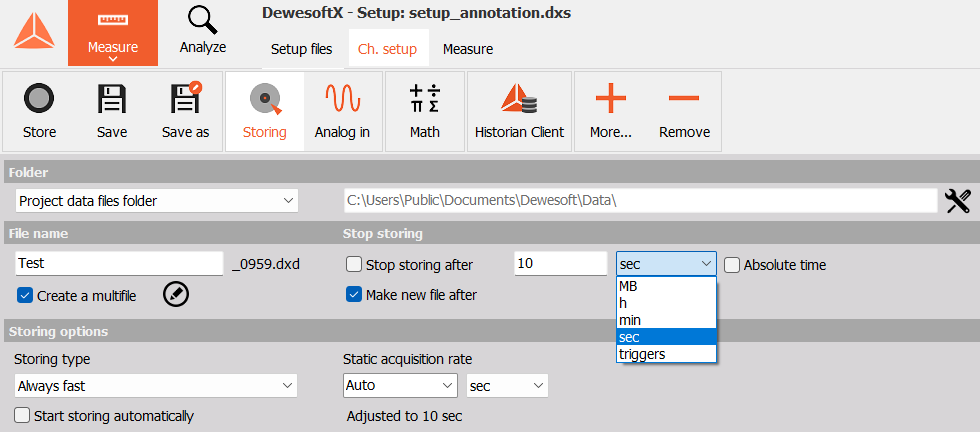
Now, go to Channel Setup and open the Storing section. Configure the storing functionality to create files sequentially by enabling the "Create a Multifile" option and checking the "Make new file after" checkbox. Enter the desired file-saving interval in seconds (10 seconds or more is recommended), and ensure "sec" is selected as the unit from the dropdown menu.

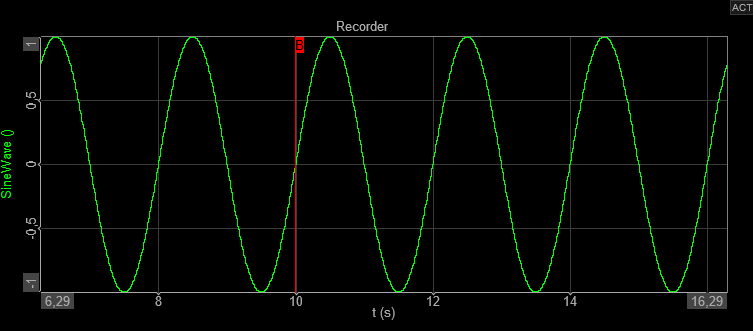
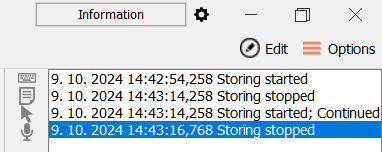
Once DewesoftX file storage is configured, click "Store" to begin the measurement process with file storage enabled. DewesoftX will enter measurement mode, and if the storage configuration is correct, a red annotation will appear on the graph at each defined interval, indicating the occurrence of a new storage event.


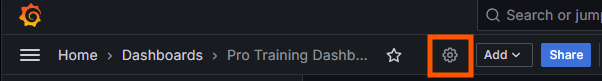
With your Data_eventchannel activated, storage properly configured, and DewesoftX running in measurement mode, switch to Grafana in your web browser. Locate your dashboard and open the dashboard settings.

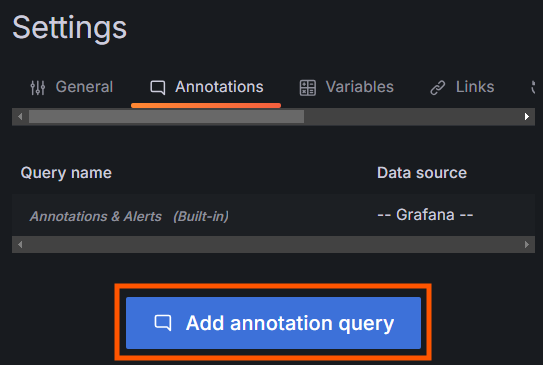
Go to the Annotations section and click "Add annotation query" to configure a new query that fetches and displays event data, such as the "Storing" events from DewesoftX.

To properly configure annotations in Grafana using data from InfluxDB and events from DewesoftX, follow these steps:
Assign annotation name:
Assign a descriptive annotation name that makes it easy to identify the specific event or data type being tracked.
Ensure the correct data source:
Configure the data source to pull from InfluxDB instead of Grafana itself.
Enable annotation auto-refresh:
Check the "Enabled" option to ensure that annotations are refreshed automatically with every dashboard refresh.
With the name of the Data_event publisher channel that was previously activated in DewesoftX, and the event name (e.g., “Storing”), construct the following query:

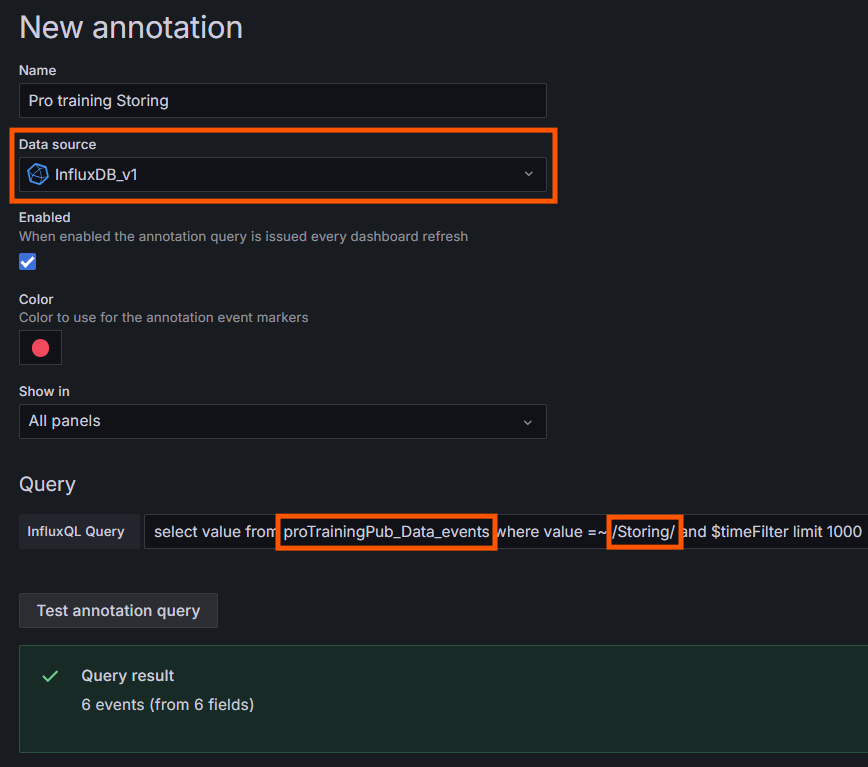
To verify whether your events were successfully stored, click the "Test Annotation Query" button. If the query returns or locates your "Storing" events, you're ready to proceed. Apply the changes, save the dashboard, and return to the corresponding graph.
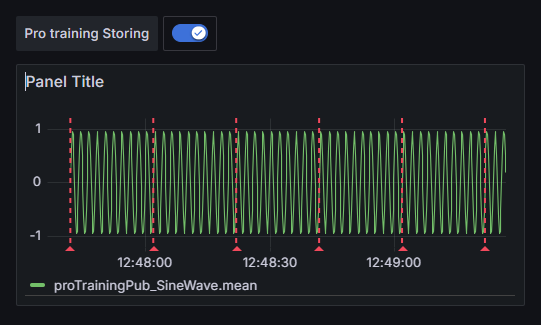
A toggle switch should appear at the top of your graph, labeled with the name of your annotation. Ensure that the graph’s time range matches the period during which the "Storing" event occurred. Finally, turn the switch on to display your annotations on the graph in the color you specified during setup.

Page 1 of 17