

What You’ll Learn 📊
Use Analysis Mode: open and review recorded data files with folder structure, metadata, and file previews
Load and visualize data: display waveform, scope, FFT, video—select ranges and triggered segments interactively
Replay and navigate recordings: control playback speed, direction, and even sound output
Add or edit math channels offline: filters, statistics, order tracking, power analysis—you choose, recalculate, and view immediately
Apply Postprocessing Actions: import displays and math from reference files, apply scaling or channel settings en masse
Work with Events & Video: insert markers, synchronize post-recording video, and analyze key moments
Export and publish results: copy visuals, print screens, export data or entire dashboards for reports
Course overview
The course teaches how to turn raw recordings into polished, publishable insights. You’ll begin by entering Analysis Mode, where you can open data files, browse folders, and preview metadata and data structure via an intuitive interface.
Once a file is loaded, the course guides you through visualization tools—adding recorder, scope, FFT, or video displays, selecting specific time ranges, and replaying sessions to identify key events while optionally playing back audio.
A major highlight is post-processing: you’ll learn to add or refine math channels such as filters, statistics, power, or order monitoring. Changes take effect immediately per visible time range, and you can fine-tune settings before recalculating full-file offline math.
You’ll also learn how to export outcomes: print visual dashboards, copy images, or export data tables for external analysis, documentation, or client reporting—all within DewesoftX’s cohesive workflow.
By completion, you’ll be proficient in transforming raw acquisition data into insightful deliverables—making full use of DewesoftX’s Analysis tools for accurate, efficient, and repeatable data post-processing.
What is analysis mode?
The Analysis mode is an important part of DewesoftX for analyzing and recalculating acquired data. Once data has been acquired, there are a number of actions you can perform with it.
review data,
display data in selected instrument
display data with signal overview,
replay data,
start/stop replay and sound output,
arranging instruments,
assigning channels,
watch events,
signal analysis,
reload triggered file,
printout of instruments,
store settings,
copy elements to clipboard,
exporting data,...
To enable an efficient analysis process for the acquired data, you must exit DewesoftX Measure mode and enter Analysis mode, where you can carry out the following procedures:


| Data file action | Description |
|---|---|
| Reviewing | load acquired data stored in a file, display the file information and data in selected instrument display, replay data and select data to analyze |
| Post-processing | define and recalculate additional math channels |
| Publishing | print the displays, instruments and copy channel informations to clipboard |
| Exporting | export data for off-line analysis using other software with possibilities to export several data files at once |
How to review the data files?
Reviewing data files is a valuable step in analyzing measured data and includes the following procedures:
| Data file Action | Description |
|---|---|
| Load data file | Load acquired measured data stored in datafile, display data file information, ... |
| Display data | Display data in selected instrument display with signal overview, selecting a channel for overview window, ... |
| Include video file | Video data can be included and synchronized in Dewesoft X, zoomed, scrolled, scaled, played, resynchronized, removed from the data file, ... |
| Replay data | Start/stop, sound output selection, replay mode, replay direction, and replay speeding on different display screens. |
| Select data | Analyze acquired measured and video data with functions to have a more detailed look at the recorded data with selection range of stored data. To help measure a precise value over a long time. Selecting triggered data (to reload multiple trigger events within one file). Store settings and events. |
| Work with events | Add, display, and save keyboard, notice, and voice events. |
How to load the data files?
When starting DewesoftX and entering Analysis mode, a selection window will appear, allowing you to choose a data file to load. This window presents subfolders within your main data directory, detailed information about existing files, and the currently selected file.


Folder structure
The upper left section displays the folder structure. In this area, you can choose the location from which to load the data file. If there are subfolders, you can open them by double-clicking.
To navigate to a higher-level folder, either click the ‘up’ button or use the Browse button to select a new folder. You can set the current folder as the default by right-clicking in the folder list and selecting ‘Set as default’.


List of Data Files
In the upper right section, you can select the file to be loaded for analysis by double-clicking on it. This section also provides detailed information about all files available in the selected folder.
| Property | Description |
|---|---|
| Name | Name of the file. |
| Size | Size of the file in kB or in MB (1 kB = 1024 Bytes). |
| Start store time | Date and time when the file has been modified. |
| Version | The version of Dewesoft X used to acquire the data file. |
| Sample rate | The used sampling rate; it will also show the reduced rate if the data was stored slow and fast on the trigger. |
| Channels | Number of active channels. |
| Store mode | One of the four storage modes: 'always fast', 'always reduced', 'fast on trigger or always reduced', and 'fast on trigger'. |
| Video | Video type and file size (available only when a video has been recorded). |
'Settings' tab Informations
At the bottom of the window, you'll find tabs for Settings, Events, Data Header, File Locking, and Preview of the selected file. By default, the Settings tab is selected.


This section displays general information about the selected file in the General File Information area (such as sample rate, storage date and time, number of channels, and trigger conditions), as well as more detailed data in the Channel Info section.
| Information | Description |
|---|---|
| Ch. No. | Channel number. |
| ID | ID number of a channel. |
| Name | Channel name and color of the channel. |
| Amplifier | Settings Type, input range, and filter range of the amplifier. For new amplifiers also the serial number is mentioned. |
| Sensor | Sensor used. |
| Rate | The rate will show the acquisition rate of each channel. This is important if the sample rate divider is used or if the channel is asynchronous (CAN, GPS, PAD,...). In this case, it will show an approximate sample rate (or keyword ASYNC with old file versions). |
| Description | Channel description |
| Unit | Channel unit. |
| Scale | Scaling factor k(y=kx+n) |
| Amplifier info | |
| Offset | Scaling offset n( y=kx+n) |
| Min | Minimum value within the whole file for the channel |
| Sensor unbalance | |
| Max | Maximum value within the whole file for the channel |
To customize which columns are shown, right-click within the columns area and select Edit columns.


'Events' tab Informations
Switching to the Events tab will display all recorded events. Events include:
start and stop of measurements,
keyboard events,
notice events, and
voice events.


'Data header' tab Informations
The Data Header tab shows all the metadata entered in the data header window at the start (or end) of the measurement. The exact content depends on the fields defined in your global header configuration.


Loading a Data File
To load any existing data file, either double-click the file or select Load data file from the main DewesoftX data menu while in Analysis mode.


How to display the data file?
As soon as you reload the measurement file in DewesoftX Analysis mode, the recorded data will be displayed. Regardless of the selected instrument type, several elements are common across all instruments.


All channel scaling, names, and unit information active at the time of recording are restored to ensure your data is properly interpreted.
Display settings can be adjusted in both Measure and Analysis modes. In Analysis mode, you can use all the features available in Measure mode: add or delete graphs and inputs, change the X-axis and Y-axis scales, and more. If you modify display settings in Analysis mode, you must manually save them by selecting Data > Store settings and events. You can also reuse these settings for the next measurement by selecting Data > Use setup for measure.
The area of interest now is the top area of the screen. Here you will find elements not available in Measure mode.
Signal Overview window
Each instrument includes, at the top of the screen, a small bar that shows a channel overview for the entire measurement:


The stored data file displays a signal overview window at the top of the screen.
symbolic display of signals in white-bordered rectangular with yellow cursor as an overview of the whole stored data
start date and time of stored data
end date and time of stored data
time selector
Within the time overview bar, a cursor is also available. By default, it is positioned on the left side of the white-bordered rectangle. If you look closely, you’ll notice a yellow vertical line—this is the cursor.
Select a channel for the Overview window
Click on the overview bar to select it. You can change the displayed channel—by default, it shows the first acquired channel. To change it, simply click on the channel name in the Channel selector. A symbolic display of the newly selected channel will appear in the overview window.


No matter what is shown in the instruments below, the time overview bar always displays the full signal. For example, if you have selected a small time segment in the Recorder within the full signal, that area will be marked in the overview bar as a white square, as shown in Image 11.
Time selector
Clicking the Time selector icon on the right side of the overview bar will open a pop-up window on the analysis screen.


Shown time - from a drop-down list in right field hours, minutes or seconds time unit can be selected
Start time - exact position within the file; in left field, the date is displayed, which can be selected from the drop-down list (the calendar is displayed); in right field start time to show measurement is displayed in form h:min:sec - we can directly enter values or select group h, min or sec and after that set values with up and down button.
The result depends on the used screen instrument: the single value elements like digital or analog meter, bar graph,... will show the current values the beginning of the selected time window, multiple value elements like the recorder, scope, FFT,... will display the signal only within the selected Time overview box (= like a zoom function).
Time overview box
Clicking the Time selector icon on the right side of the overview bar will open a pop-up window on the analysis screen.


A cursor is also present within the time overview box, positioned by default at the left side of the box. When you hover your mouse over the yellow cursor, the pointer will change—allowing you to drag the cursor within the box. As you move it, the yellow cursor on the main instrument display will move in proportion to the stored data shown.
If your data were recorded using triggers, press the Trigger button to zoom into the area between the trigger points. Use the Left and Right buttons to navigate between different triggered segments.
How to select the data range?
In addition to online visualization, the DewesoftX Analysis mode offers several functions for a more detailed examination of recorded data:
Selection range of stored data- we have options to narrow range of displayed data and select only part - a smaller range of stored data:
Measurement cursor
Zoom in time axis
Window zoom
Lock cursor 1 to select position - to help measure a precise value over a long time
Measurement Cursors for selecting the data Range


The Recorder and Vertical Recorder provide two measurement cursors for the active graph at the top, labeled Start show time and End show time. You can drag these cursors to select a specific region in two ways:
move mouse cursor to the first position of interest; click (measurement cursor appear on this position) and hold left mouse button and move (on mouse cursor appear measurement cursor and move whit him) to the second position of interest


drag the first cursor from the leftmost side of the graph to the position of interest and the second cursor from the rightmost side of the graph (when mouse point on the vertical line of measurement cursor mouse cursor change to a two-sided arrow which indicate feasibility to move measurement cursor)


No matter which recorder you use, the cursors will move simultaneously across all displayed Recorders and Vertical Recorders.
On the left side of the display, the readout values of the currently selected graph at the cursor position will be shown. To display values from a different graph, simply click on that graph and the values will update accordingly. Since there is only one time base, the cursor position is consistent across all displayed graphs.


As shown above, in Analysis mode, a new section appears on the left below the recorder settings to display the readout values of signals and time at the cursor position. This is called the Time and values cursor and includes an icon to lock the cursor.


Zoom in time axis
After loading the data, the entire signal over the complete storage time is visible. You can zoom into specific areas for more detailed inspection:
Just use both measurement cursors as described above to select an area of interest. Move the mouse between these two measurement cursors - it will change the appearance immediately to the zoom icon. Then simply do a left mouse click to zoom into the selected area. We can do this several times to come to the region of interest. We can also drag the x scale left and right to position the data exactly. To undo the zoom just use the right mouse button and you will zoom out step by step to the full scale.
Do a left mouse click on the button on the right side of the graph to zoom into the selected area. To undo the zoom use button (below +) and you will zoom out step by step. As there is only one-time base available all graph is zoomed in (or out) together, independent which button is selected. You can do that action several times to zoom into the selected area step by step (by each step is a decrease of range about 1/25 prior range) and is meaningless in what place cursor there is. By first zoom out graph return to previous zoom (range) and after that step by step. If we use before multiple zoom (with +button or measurement cursor), in the first step displayed range to return to about 3/4 its whole range and after that step by step.
Once zoomed in, more signal details will be visible.
The signal overview bar at the top of the Recorder display always shows your current position within the signal. You can also click and drag the marked area to reposition the displayed portion of the signal. This action can be repeated as needed to explore the parts of the signal that interest you most.
Lock the 1st Cursor to the selected position
You can place the measurement cursors anywhere within the acquired signal. However, if you need to measure a precise value over a long duration, it may be difficult to set the cursors at exactly the right points due to resolution limitations.
The solution is simple: Zoom into the signal at the desired starting point and position Cursor 1. Then, press the lock cursor icon to fix Cursor 1 in place. The icon will change to indicate the cursor is locked, the cursor color will turn green, and the label will change to "locked".
Now you can zoom out and then back in to the desired endpoint. A temporary Cursor 1 will appear for navigation purposes only—it is not used for measurements. The original Cursor 1 remains locked at its initial position. Use Cursor 1 and Cursor 2 as previously described to define your second area of interest. Then, move Cursor 2 to the point of interest, and you can read the required values from the Time and cursor values readout section.
To unlock Cursor 1, simply click the lock icon again. The lock will disappear, and Cursor 1 will be free to reposition. The same process applies to Cursor 2.
How to select the triggered data?
If your data consists of events that can be captured, you can choose to store fast on trigger. To learn more about triggered storing, visit the Storing Options PRO training course.
The trigger event can be defined within the software. Once set, DewesoftX will wait for this event and perform the corresponding actions.
store only the portion of interest by choosing "fast on trigger" storing option
acquire data with two speeds (to have reduced data also for the regions without trigger event) - we need to use a different strategy "fast on trigger, slow otherwise".
'Fast on trigger' triggered data file
When reloading multiple trigger events within a single file, a different display appears. Only the trigger events are stored, and the data outside those events remains blank.


Note that a new trigger mode button ![trigger icon] is available in the data preview. This feature allows you to review trigger events without manually zooming into the data. When pressed, the first trigger event is automatically zoomed in. The trigger mode button then changes to navigation arrows ![arrows icon], enabling you to browse between events. By using these buttons, the recorder displays the trigger events one by one. In the data preview, you’ll see the currently selected trigger event. For the first trigger, only the forward arrow is available to navigate to the second trigger; for the last trigger, only the backward arrow is shown.


To exit trigger mode, simply right-click on the recorder and select zoom out to full region.
'Fast on trigger, slow otherwise' triggered data file
If you acquire similar data using this strategy and reload it, you'll notice in the preview below that data has also been reduced for the regions without trigger events.


When zooming into the data, you’ll see reduced stored data before each trigger—this consists of the minimum and maximum signal values. In the triggered region, however, you’ll see the data stored at full speed.


How to replay the data file?
In any instrument, it is possible to replay the data in real time, either faster or slower.
DewesoftX offers special control buttons for this purpose:
Start/Stop,
sound output selection,
replay mode for selection different ways of replay,
replay direction and replay speed.


Using these four buttons, you can control the replay process:
start / stop the replay,
define a channel for a sound output,
change the replay mode, and
change the replay speed and replay direction.
Start/stop replay
To start the replay simply press the play button . DewesoftX will immediately start to move through the acquired data: the FFT is calculated, the scope shows the current data, the video file is replayed, digital or analog meters, bar graphs,... will change their value continuously and in recorders or scopes you will see the yellow cursor moving to indicate the current position within the file.
Once the replay has started, the Play button will change to a Stop button. To stop the replay, simply press the Stop button. After stopping, don’t forget to select None in the loudspeaker menu to disable audio playback.
Sound output
If you have stored audio, you can even listen to it. Next to the Play button is a loudspeaker icon with a red cross. Clicking this icon will bring up a channel list from which you can select analog input channels to route through the sound card. Once a channel is selected, the red cross disappears, and pressing Play again will allow the audio to play through the loudspeakers.


After pressing the Stop button to stop the replay select None at the loudspeaker icon to switch off audio replay.
Replay mode
You can choose between three different replay modes by clicking the third button from the left. The replay mode can also be changed while the replay is in progress.
| Mode | Description |
|---|---|
| Normal mode | Replays data once from the beginning to the end of the file or the selected time window. |
| Loop mode | Replays data continuously from the beginning to the end of the file or the selected time window. |
| Scroll mode | Replays data once from the beginning of the selected time window to the end, then it continues to replay by moving the selected window until the end of the file is reached. |
The replay mode can be changed also during a running replay process.
Replay speed
Use the speed control button to change the replay speed—either faster or slower.
You can slow down the replay to:
1/2x, 1/4x, 1/8x, 1/20x, 1/50x, 1/100x, 1/200x, 1/500x, 1/1000x, or 1/2000x real-time.
Or you can speed up the replay to:
1x, 2x, 4x, 8x, 10x, 100x, 1000x, 2000x, or 5000x real-time.
The replay speed can also be adjusted dynamically during an ongoing replay.
How to work with events?
You can also view all your events—keyboard, notice, and voice types—on the event list at the top right, directly below the replay control buttons.


Select any event either by clicking on its white or gray vertical line on any recorder graph or by scrolling through the EVENT selector at the top right of the screen. This is a scrolling list that shows all events.
when data recording began - indicated by a vertical red line on the graph with a (beginning) at the top, and each type of event, listed in chronological order, and marked with the exact time that they occurred,
the end of the recording is also marked with a vertical red line and an (end) at the top,
if you click on a voice event, it will replay using the speakers in your computer (assuming that you have this DirectX sound recording / replay capability),
if you click on any notice event, it will show in the EVENT section, and just by hovering the mouse over the gray vertical line, the text that you typed in at the time of recording.
Keyboard events show the exact time that they occurred.
Manage Events
As mentioned before, all events are displayed in the recorder. To add an event, simply click the Notice icon or press the shortcut key (for example, <n> for a notice event), and the event entry window will pop up. The time of the event is pre-filled. Enter the event text and press the Add button to confirm and add the new event.
To modify a previously entered notice, right-click on it in the list. From the displayed menu, select Edit, and the Enter Event window will appear. In this window, the Add button will change to an Update button, which you can click to apply changes made to the Event text field. To delete a notice, select Remove from the displayed menu.


You can enter as many events as needed. The event types—Keyboard Event, Notice Event, and Voice Event—can be freely mixed (see image 25).
When you select the Events tab, you will see entries for all old and new events.


Event Types
Using different types of events, you can mark your data files. Traditional chart recorders have event markers that are used to highlight areas of interest in the data for later review. DewesoftX enhances these capabilities by offering three types of data markers:
Keyboard Events – Press the spacebar or click the keyboard event icon to mark an area of interest. A thin gray vertical line will appear at the corresponding point in the data, marked with a symbol, and a notice is added to the scrolling EVENT list.


Notice Events - press < n > key on your keyboard or click the notice event icon, then enter your text in the dialog box that appears.


When you confirm by clicking the Add button, the text is added to the recording. You can also click the OK icon on the screen to enter a notice event. The event is marked with a thin green vertical line, an “N,” and a corresponding icon at the event location.


Voice Events – If you have a DirectX-compatible sound card, you can use a microphone to record spoken annotations. Simply press and hold the <v> key or click the microphone icon, and speak into the microphone. Release the key when you're done. These voice events can later be replayed through your speakers and are an excellent way to add context to your data. They are marked with a “V” icon and a thin vertical blue line.
Events can also be added, edited, or deleted in Analysis mode.
How to post synchronize the video?
DewesoftX supports many different video cameras for online use. However, there are cases (for example, with very fast video cameras) where the data file and the video file come separately from a frame grabber. It is possible to synchronize these two files in Analysis mode using just two simple steps:
Include Video file to copy video file and re-name it according File name conventions
Video synchronization to synchronize video file with analog data in the DewesoftX data file with:
synchronization settings
resynchronize files
storing post synchronization information
File name conventions
To include a high-speed video in DewesoftX, only a few steps are required:
After the acquisition of video file and the DewesoftX measurement data, please copy *.avi high-speed camera file to the directory (via Windows Explorer) where the Dewesoft X data to be synchronized is located.
Please rename the video file to this specification: xxxxx.cam0.avi, where 'xxxxx' is the name of the DewesoftX file to be synchronized. If we have more video files, we can name then xxxx.cam0.avi, xxxx.cam1.avi, xxxx.cam2.avi, and so on.


Image 31 shows an example of how this looks like. Original DewesoftX file is DF_AUTO_VTE_brake_test_thermo.dxd and therefore a video clip should be named DF_AUTO_VTE_brake_test_thermo.cam0.avi. After this open DewesoftX, press the Analysis button to enter the Analyse mode and you should see already video file as part of the DewesoftX data file.
Synchronization settings
After including the video in the data file, double-click the file to open it. DewesoftX will recognize that the file lacks synchronization information and will prompt you to synchronize it manually.


he synchronization window displays the video file name and the number of stored frames (Frames found). Change the frame rate to match the actual capture rate of the camera (sometimes .avi iles contain the correct values, but often they do not). As an additional aid, the Video size field shows the video duration (in seconds) based on the currently selected frame rate.
Next, specify the Pre-trigger—how many frames were captured before the video trigger occurred. You can choose the unit as frames, seconds, or milliseconds.
Trigger time defines the video’s start position. You can choose:
From trigger: Synchronization starts at the trigger event (or the start of measurement—i.e., analog data recording). In this case, both the measurement system and the video camera must use the same trigger source.
From relative time: The start time is counted from the beginning of the measurement in seconds.
After configuring these settings, press the OK button. The files will now be synchronized; however, this synchronization information is not yet stored! DewesoftX will now display both files in the Video display.
Resynchronize files
The video display behaves like any other instrument in DewesoftX—you can zoom, scroll, scale, play, and more. If the synchronization is not perfect, it can be adjusted by navigating to Data files → Post-sync. video.


This opens the same Video Post-Synchronization window described in the synchronization settings, with an additional feature: Trigger time.

This is a very useful feature because you can zoom into your display, move the yellow cursor in the recorder to an exact position, and then select Video Post-Synchronization from the Data menu. When you do so, the video will align with the yellow cursor's position. This also works if a pre-trigger is required.
Using this function, you can shift the video file's position forward or backward within the data file as needed.
Storing post synchronization information
Currently, there is no dedicated Save button for synchronization. To avoid redoing the synchronization setup every time, simply click the Analysis button to return to the file selection list. A warning message will appear, asking if the synchronization information should be saved.
If you select Yes, the synchronization data is written directly into the video file (not the data file), making it available permanently—no further synchronization will be necessary.
Warning: Once post-synchronization data has been stored, it cannot be changed.
Therefore, it is strongly recommended that you keep a backup copy of the original video file without synchronization data.
Remove video from data files
To remove the assigned video from the data file, simply rename or delete the video file. Since the synchronization data is stored in the video file itself, DewesoftX won’t display an error message—even though the video disappears—because the data file doesn't reference it explicitly.
How to post process the data?
A great feature of DewesoftX is post-processing. It allows us to:
add new math channels in analyze mode,
modify existing math channels,
change scaling of online or offline channels.
There are several ways to perform mathematical analysis on already acquired data.
Let’s start with a simple one. To add a basic math channel—such as a filter—we select the channel from the Channel Selector, right-click, choose Add Math, and then select the appropriate mathematical function.


In this example, we have added an FIR filter. Once the filter is set, the data is automatically recalculated and displayed in the current view.
Next, we can edit the created math channel (or any other math channel added during measurement or offline) by clicking on it and selecting either Edit Math or Delete Math (in this case, Edit FIR Filter or Delete FIR Filter).


By clicking Edit, the editing window for the selected math function will open, allowing us to change the calculation parameters. After closing the window, the channels will automatically be recalculated.
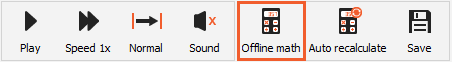
More advanced math can be defined in the Math section by pressing the Offline Math button or the Setup button from the top menu.

In Analyse Mode, under the Setup tab, we can prepare math channels just as we would in Measure Mode, including advanced analyses such as Power Analysis, Order Tracking, Modal Analysis, and others.


When finished, go back to the Review tab. Please note that the Offline Math icon will now change to Recalculate.


Next, select the start and end time range for recalculation and press Recalculate. All added math channels will be calculated accordingly. Once recalculated, the button changes back to Offline Math, indicating that we can return to the math setup and modify parameters to refine the results. Additionally, we can change the color, scale, and offset of any channel.
DewesoftX also allows automatic recalculation of data when zooming in or out, which is particularly useful when searching for an absolute minimum or maximum within a specific time slice.
Finally, we can save the results of post-processing by clicking the Save button.
How to use apply action?
When we have completed math analysis for a single data file, the same calculations can be applied to multiple data files.
One option is to click the round DewesoftX button, choose Load Display and Math Setup, and then select the appropriate setup or data file that contains the desired calculations. After that, select Recalculate and Save to complete the process.
Another option is to select multiple files under Analyse → Data Files, and then choose Apply Action.


Another option is to select multiple files under Analyse → Data Files, and then choose Apply Action.


Next, select the original setup or data file that contains the defined offline math. Ensure that the channels in the selected files match those in the original file. A progress bar will appear, and all the selected files will be recalculated accordingly.


How to lock a file?
We have seen that it is possible to modify data files as needed. However, it is often necessary to preserve the integrity of these files by locking them to prevent further processing. This can be done by enabling file locking. To do so, open the data file and select File Locking.


Files can be locked in two ways: With a password, which must be entered the next time the file is opened, or Permanently, which prevents any further modifications without the option to unlock.
File locking can also be enabled during the measurement process.
For more information, refer to the How to Set Up Dewesoft – Security course.
How to print and copy data?
DewesoftX Analysis mode offers several options for publishing data.
screen printout - printing measured data for the instrument on all available printers with the possibility to set:
page orientation
enter Header on measurement
multiple page printout
copy visual elements - copy to clipboard or copy widget data to another application
Screen printout
Printing Instruments and Setups
In Analysis mode, DewesoftX provides a printing function that works with any instrument (Overview, Recorder, Scope, etc.) as well as with the setup screen. To print, simply: select the instrument, change the appearance as desired (see previewed page in the middle of the screen) and press the Print button.


Page orientation
You can choose between Landscape and Portrait page orientation.


Notes on measurement and page header
In the Header text, you can enter custom text in the header section. First, enable the Show header option, then enter your comment in the Header text field.


In addition to the text header, DewesoftX also includes file name, page number, date, time of measurement, and elapsed show time in the header.
Multipage printout
To create a multipage printout:checking the Multipage box. After that select time unit (sec, min, hrs) from the drop-down list and enter time resolution.


Example: If the measurement duration is 1 minute 35 seconds and a time resolution of 40 seconds is set, DewesoftX will generate three pages: -> first page for measurement time 0 - 40 sec, 2nd for 40 - 80 sec, and 3rd for 80 - 120 sec.
You can also set an overlap time, which repeats a portion of the timeline on adjacent pages for better visual continuity.
Example: When for example above the Time scale=15 sec is entered, multipage printout with 4 pages in all is defined first page for measurement time 0 - 40sec, 2nd for 25 - 65sec, 3rd for 50 - 90sec and 4th for 75 - 115sec.
Use the Next and Previous buttons to preview each page in the multipage printout.
Printing
After all desired properties are set press the Print command button below print menu settings. This will open the standard Windows® Print window, where you may define your printer properties, print range, and copies as in other programs and start the printing job.


DewesoftX supports the full Windows® printing system, including default and network printers, and it works with printer spoolers.
You can continue working in DewesoftX even while the print job is still in progress.
Copy visual elements
For documentation in external applications, you can also copy display elements to the clipboard.


Select the desired instrument and select from the Edit menu:
| Copy to Clipboard option | Description |
|---|---|
| Widget as image | Copies only the selected widget |
| Widget group as image | Copies the whole group of selected widgets |
| Display as image | Copies the whole screen as an image |
| Widget data | Copies channels data from the selected widget |
| Widget group data | Copies channels data from the whole group of selected widget |
| Widget group | Copies widget with selected channels |
| Display | Copies whole display with widgets and their data |
Page 1 of 14