Table of contents
Browse categories
Browse authors
 AL
ALAlessia Longo
 AH
AHAl Hoge
 BJ
BJBernard Jerman
 BČ
BČBojan Čontala
 CF
CFCarsten Frederiksen
 CS
CSCarsten Stjernfelt
 DC
DCDaniel Colmenares
 DF
DFDino Florjančič
 EB
EBEmanuele Burgognoni
 EK
EKEva Kalšek
Franck Beranger
 GR
GRGabriele Ribichini
Glacier Chen
 GS
GSGrant Maloy Smith
 HB
HBHelmut Behmüller
 IB
IBIza Burnik
 JO
JOJaka Ogorevc
 JR
JRJake Rosenthal
 JS
JSJernej Sirk
 JM
JMJohn Miller
 KM
KMKarla Yera Morales
 KD
KDKayla Day
 KS
KSKonrad Schweiger
Leslie Wang
 LS
LSLoïc Siret
 LJ
LJLuka Jerman
 MB
MBMarco Behmer
 MR
MRMarco Ribichini
 ML
MLMatic Lebar
 MS
MSMatjaž Strniša
 ME
MEMatthew Engquist
 ME
MEMichael Elmerick
Nicolas Phan
 OM
OMOwen Maginity
Patrick Fu
 PR
PRPrimož Rome
 RM
RMRok Mesar
 RS
RSRupert Schwarz
 SA
SASamuele Ardizio
 SK
SKSimon Kodrič
 SG
SGSøren Linnet Gjelstrup
 TH
THThorsten Hartleb
 TV
TVTirin Varghese
 UK
UKUrban Kuhar
Valentino Pagliara
 VS
VSVid Selič
 WK
WKWill Kooiker
DewesoftX 2023.5 Released - Enhanced Navion Plugin

Eva Kalšek
August 28, 2025
We are excited to announce the release of DewesoftX 2023.5. The new version introduces an enhanced Navion plugin that provides comprehensive mounting visualization and an additional coordinate system based on the ISO 8855 standard. You can now easily manipulate the size of the shown time-domain area directly from the overview widget on the top of the DewesoftX screen. Furthermore, a new SRS graph widget is available, tailored for various NVH applications. You can also now define Vector reference curves within custom frequency bands.
Don't forget to check out the What's New section for all the other exciting upgrades and features we’ve added. We are sure you will find DewesoftX 2023.5 even more powerful and versatile.
Navion i2 mounting visualization and ISO 8855 coordinate system
Adjustable zoomed region selector on overview widget
Frequency band option for vector reference curve
Shock response spectrum widget
What else is new?
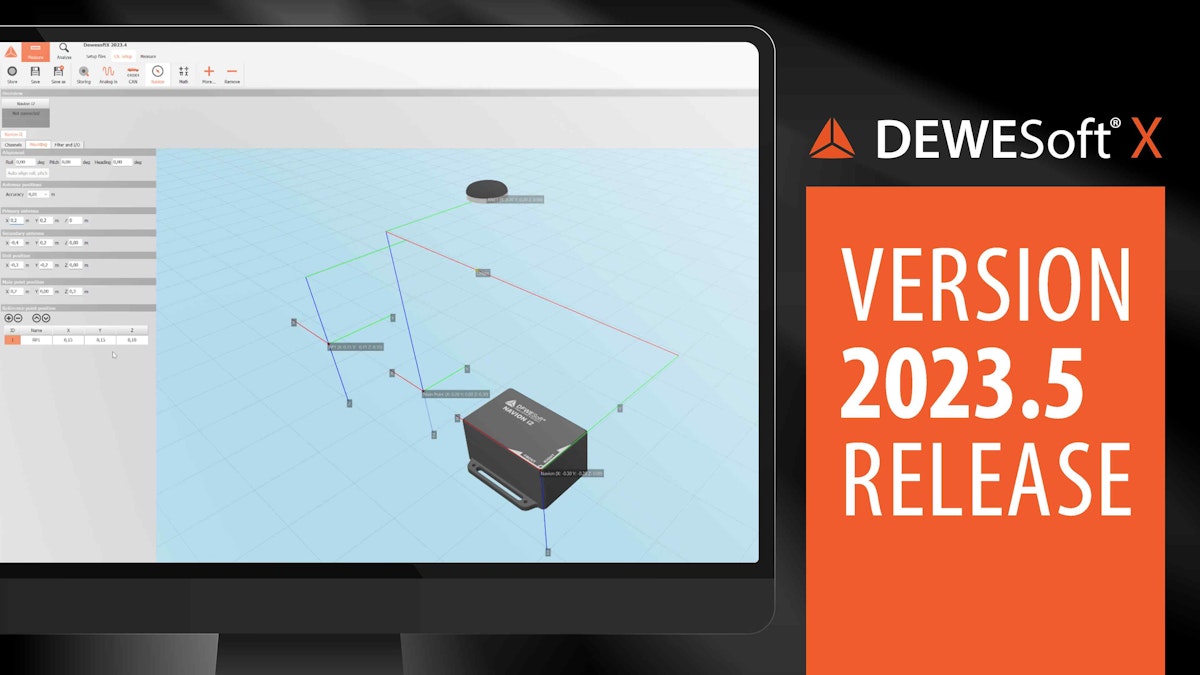
Navion mounting visualization and ISO 8855 coordinate system
Our newly integrated, user-friendly 3D visualization inside the Navion plugin minimizes use errors by intuitively showing all mounting and measurement points in a highly intuitive manner. The visualization includes the positions of both antennas, the Navion i2 unit, and all measurement points. This enhanced feature allows you to navigate and inspect an object’s position and orientation.
In addition, our plugin now supports the ISO 8855 coordinate system, a widely accepted standard for representing spatial positions and orientations in 3D space. This enhancement improves compatibility with various navigation data formats. You can also customize your preferred acceleration and velocity units for added convenience.
A default measurement screen prominently displays essential channel outputs, simplifying device setup and usage. These features significantly enhance overall usability, making it the ultimate integrated navigation system designed to minimize potential use errors.


Adjustable zoomed region selector on overview widget
In Analyze mode, at the top of the DewesoftX screen, there’s an overview widget that shows the entire time range of the recorded data file, even when you focus on a specific part of the data.


When zooming in on the time data, a zoomed region selector showing your zoomed-in area appears on the overview widget. You can now adjust the size of the selector directly on the overview widget by using the left and right box handles or by scrolling the mouse wheel. In other words, this new feature allows you to zoom in on the data even if you don’t have a dedicated time data widget on your display.
Frequency band option for vector reference curve
We have now enriched the Vector Reference curve math with the option to define a reference curve built of multiple custom frequency bands.


When you define a reference curve by frequency bands, the 2D graph widget only displays it within the frequency ranges defined by you. You will see the space between two reference bands as a gap on the frequency axis. You can also apply overlapping frequency bands.


Combined with the Signal Bound Check option, this functionality is a valuable signal monitoring tool, particularly beneficial in applications requiring more detailed tolerance definitions, such as for jet turbine engine testing.
Shock response spectrum widget
A shock response spectrum (SRS) tripartite graph is a graphical representation used in engineering and structural analysis to characterize the response of a structure to a shock or vibration input.
By analyzing the SRS graph, you can identify critical frequencies at which the structure may resonate or experience high response levels. This feature is essential when you design structures or components to withstand such dynamic loads. Shock response shows the relative displacement, velocity, and acceleration all on one graph.


What else is new?
You will find additional details about all features listed below on Dewesoft’s Customer Support Portal:
The channel filtering functionality extends into Math modules and the channel selector in Measure mode.
CAN message channels, Global variables, and Data Header can be shown at unsupported exports
Export orders for Global Variables and Data Header channels are definable inside their settings.
Paste functionality on the DS-Grid was optimized, resulting in a quicker grid update.
Channel recalculation is no longer needed when the name of any Math module is changed.
Runout compensation measurements at variable speeds, e.g., during coast down, are now supported in Orbit Analysis.
Latch Value Math now supports array channels as input and also offers a standard set of trigger conditions.
Workflow of Sound power measurements for earth-moving machinery is now supported following ISO 6395.
Amplifier Disable Mode is a safe mode in which you can choose whether all amplifier functions (Excitation, TEDS scan, etc.) are operative or not. The feature is currently available for SIRIUS STG and HS-LV amplifiers.
The Modal Geometry widget has been improved and now also supports both intrinsic and extrinsic-defined angle rotations.
DewesoftX 2023.5 is a free upgrade for all Dewesoft customers and is compatible with all Dewesoft data acquisition systems. You can download it from our download center, where you will also find a changelog listing all the minor improvements and bug fixes.